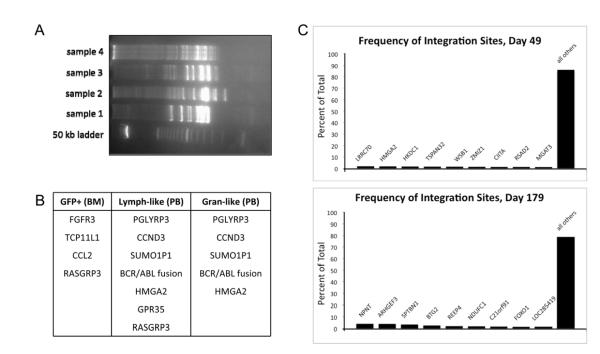
Figure 7. Integration site analysis.
Retroviral integration site analysis was performed at day 82 in L09025 (A and B) and day 49 and 179 in T09214 (C). For L09025, three separate populations were analyzed: GFP-sorted cells from bone marrow (BM), lymphocyte-like cells from peripheral blood (PB), and granulocyte-like cells from PB. The gel (A) shows numerous bands indicating a polyclonal population. The table (B) lists the integration sites that were found in each population (integration was either in or within 125,000 base pairs of each gene listed.) Several of the sites turned up among multiple populations, thus indicating that true repopulating cells were expanded. Analysis of PB in T09214 (C) at day 49 and day 179 revealed nearly 300 unique integration sites at each time point; the graphs show the frequency of the top 9 most common sites and indicate relatively uniform site distribution with no evidence of clonal outgrowth.

