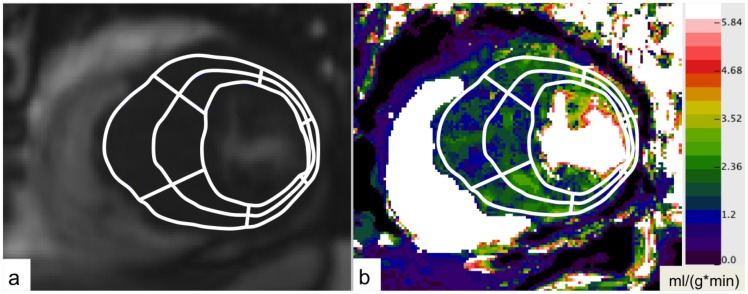
Figure 1. Pixel-by-pixel calculation of quantitative MBF maps.
Quantitative MBF map in the short axis view of an HCM patient. MBF values are given in ml/(g*min). A region of interest (ROI) was drawn, outlining the LV walls. The ROI was divided into 6 segments per slice with further subdivision in epi- and endocardial half.

