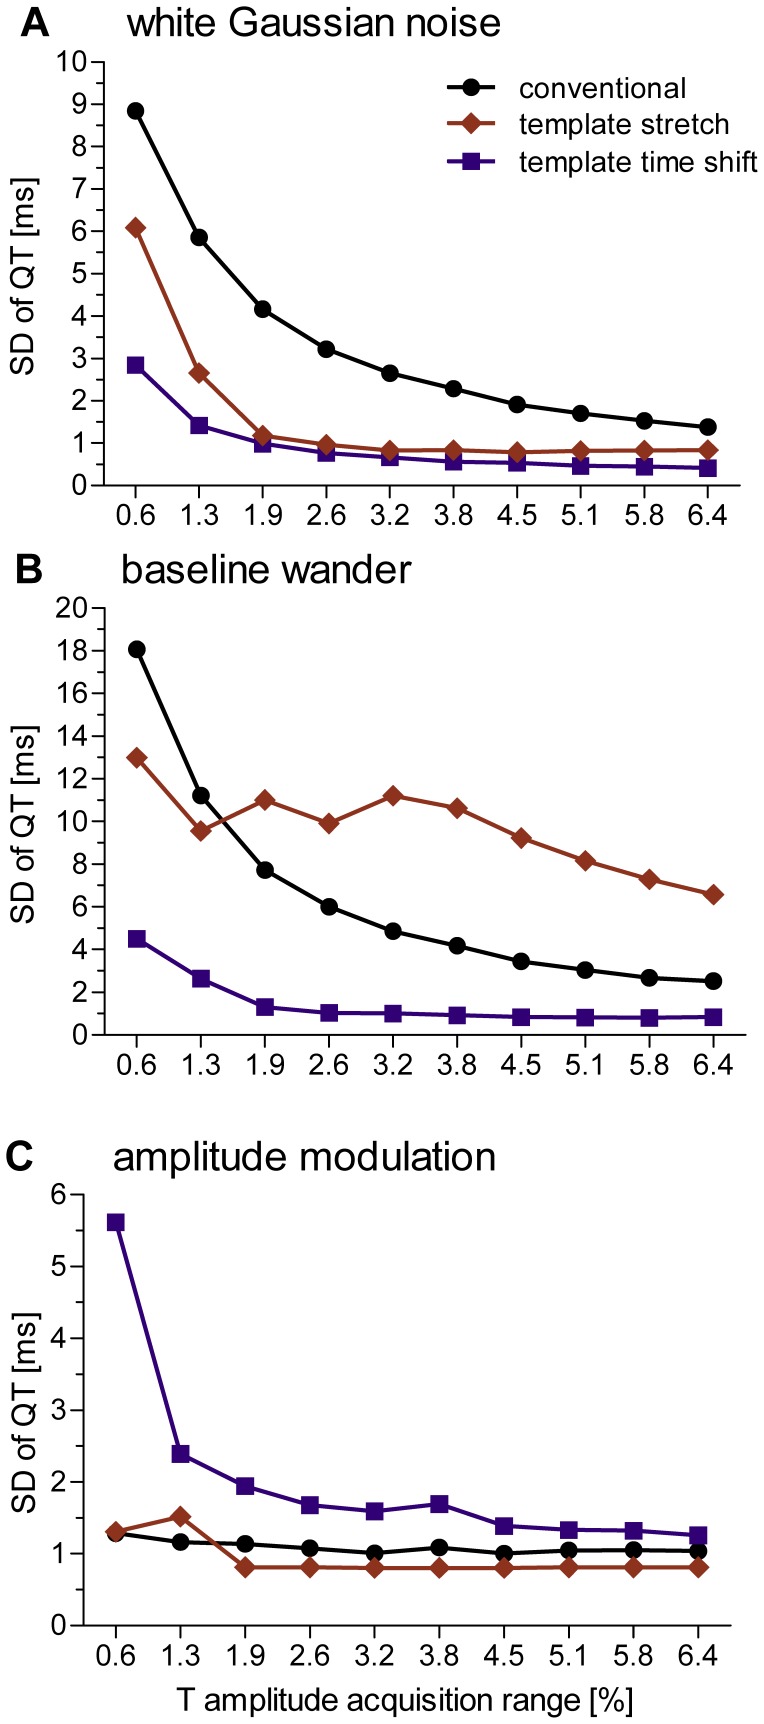
Figure 2. Accuracy of QT measurement algorithms.
Data are expressed as standard deviation of beat-to-beat QT interval as a function of T amplitude acquisition range measured during simulated broadband noise (A), periodic baseline wander (B) and periodic amplitude modulations (C), using a conventional QT measurement algorithm (black dots), the template stretching algorithm (red diamonds) and template time shifting algorithm (blue squares).

