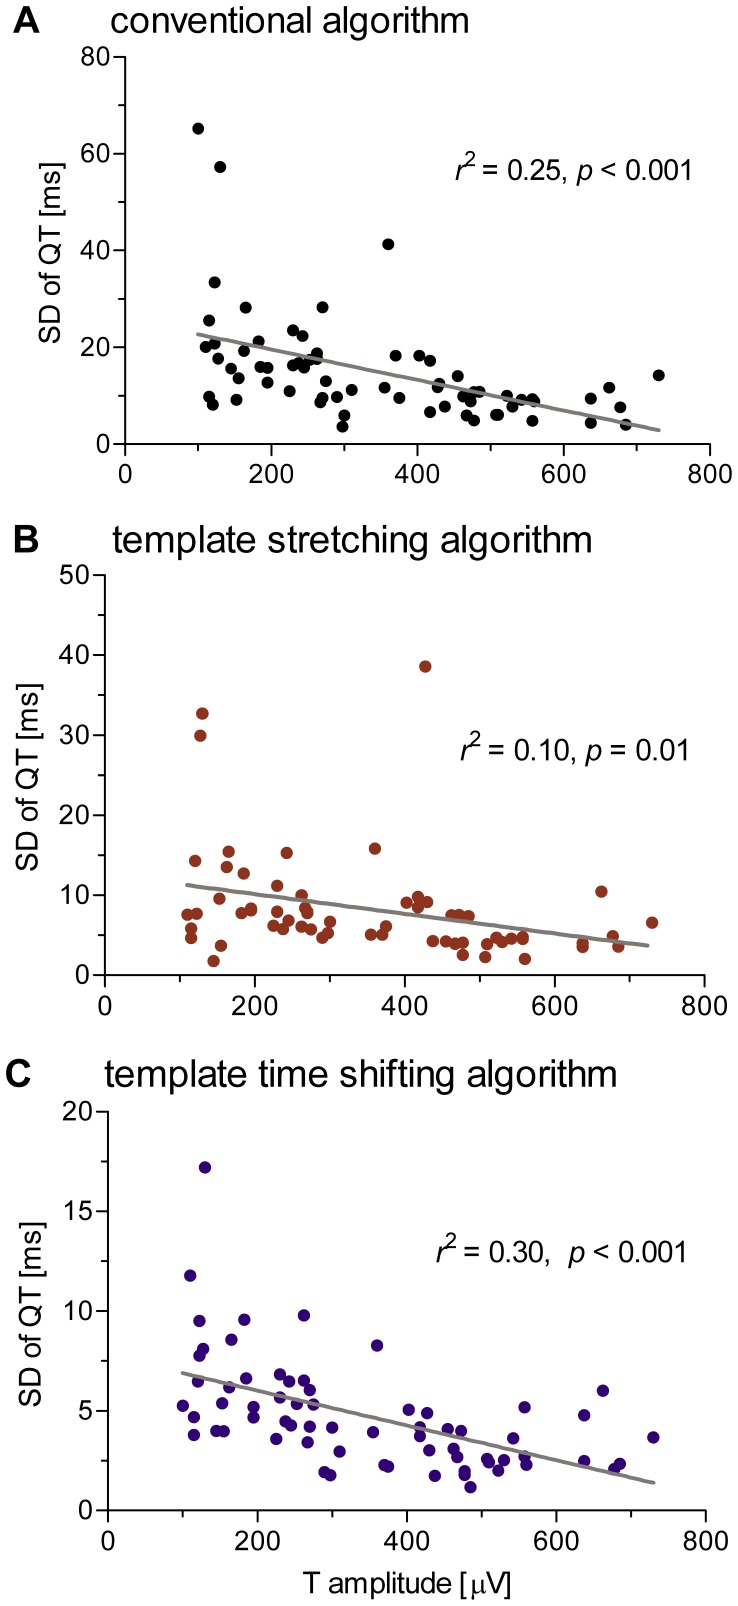
Figure 5. Relation between QTV and T wave amplitude.
Results were obtained with the conventional (A), template stretching (B) and template time shifting (C) algorithms and show a significant negative correlation between QTV and T wave amplitude, contributing between 10% and 30% to the overall variance in QTV that was observed across patient ECGs.

