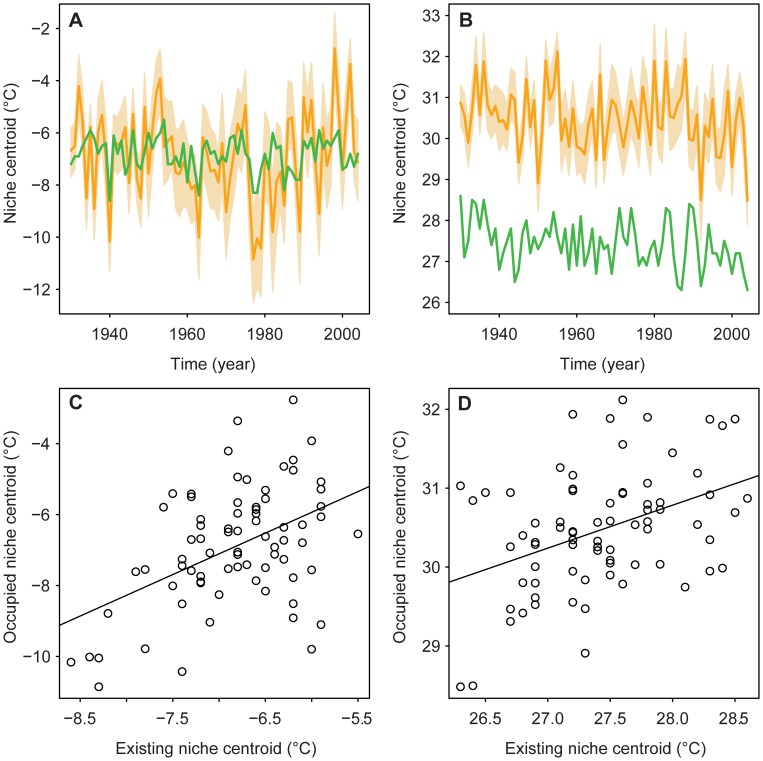
Figure 2. Time series of the occupied and existing LD50 niche centroid locations in climate space: (A) minimum temperature of the coldest month; and (B) maximum temperature of the warmest month.
Light orange polygons show the 95% confidence intervals, and dark orange lines the means, of occupied niche centroids evaluated for 100 bootstrap samples (controlling for sample size over time, see Materials and Methods). Green lines show the existing LD50 niche centroids. Plots of the annual location of the occupied niche centroid versus the existing LD50 niche centroid, 1930–2004, for: (C) minimum temperature of the coldest month; and (D) maximum temperature of the warmest month. Solid lines show slope of observed Pearson’s correlations.

