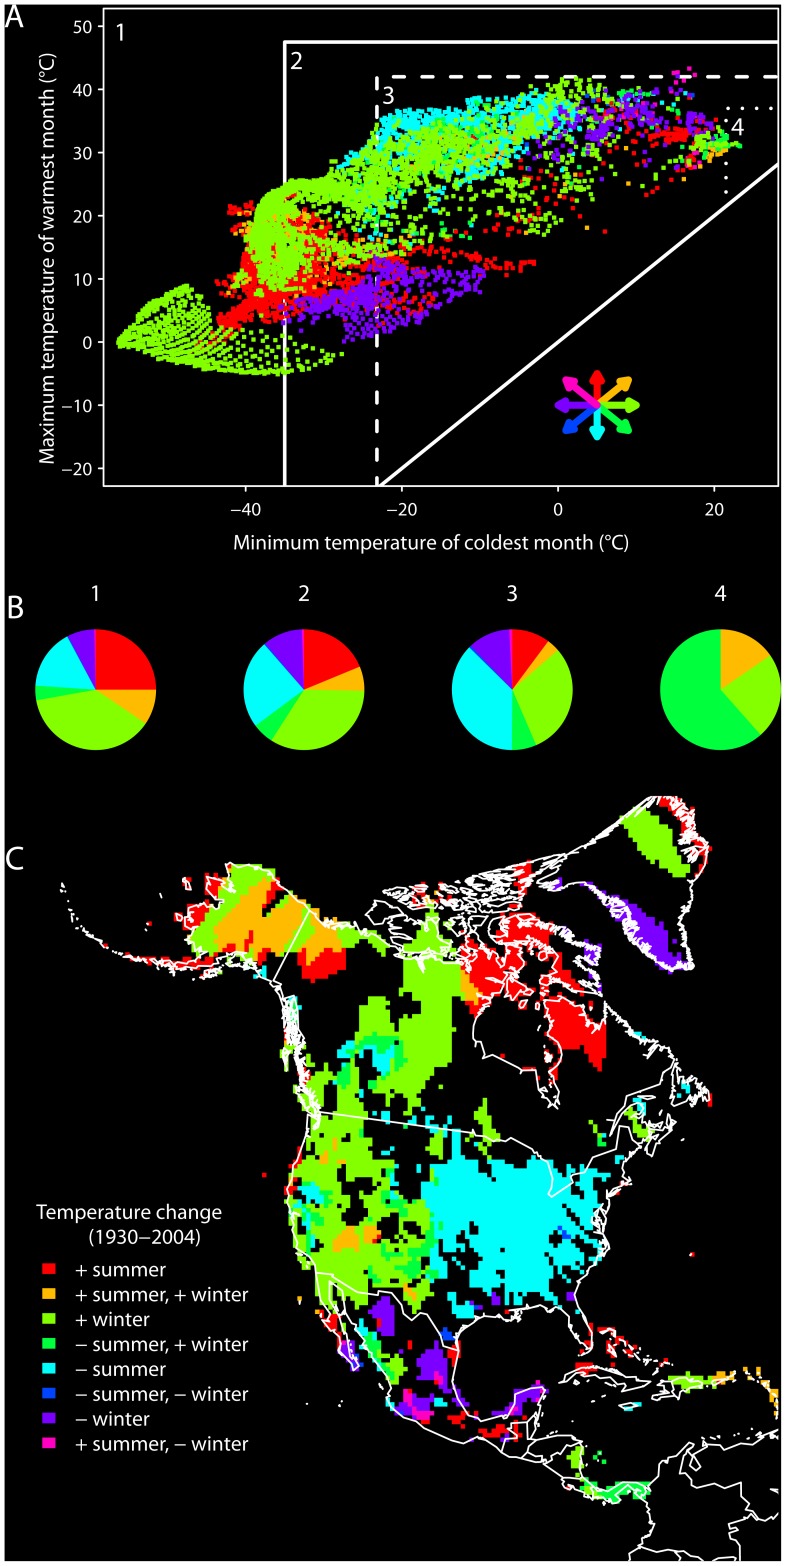
Figure 3. Directional changes in temperature for North America, 1930–2004.
(A) The contemporary environmental space showing grid cells that changed in a directional fashion with respect to minimum temperature of the coldest month or maximum temperature of the warmest month (colored grid cells, with directionality symbolized by arrows, matching legend in panel C); grid cells that did not experience directional change are not shown. Labeled regions delineate environmental spaces with respect to different thermal niche fitness thresholds for the house sparrow: (1) the full environmental space; (2) the fundamental LD100 niche; (3) the fundamental LD50 niche; and (4) the fundamental TNZ niche. (B) Pie charts show the proportions of grid cells undergoing each class of directional change within each of the four spaces. (C) Geographic projection of grid cells that experienced directional changes in minimum temperature of the coldest month or maximum temperature of the warmest month. Positive (+) = increasing temperature, negative (–) = decreasing temperature.

