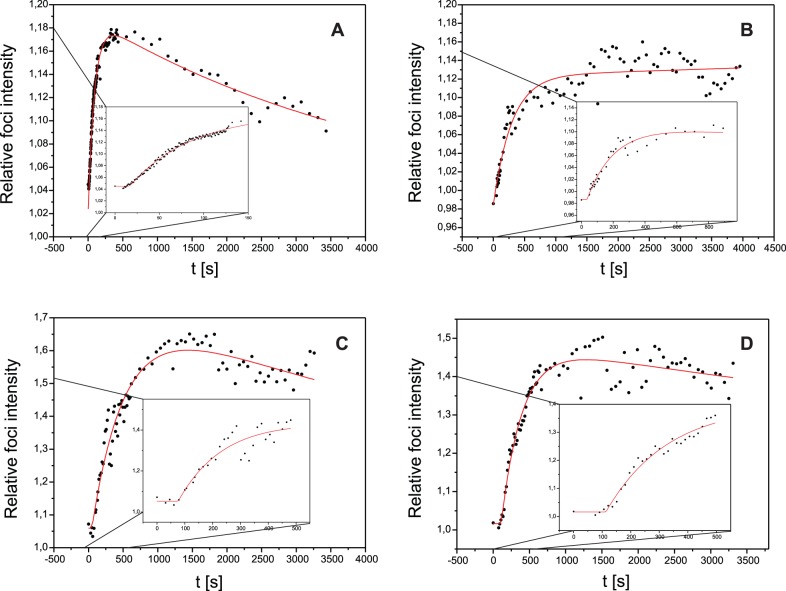
Figure 2. Foci intensity vs. time after irradiation.
The relative foci intensity Irel = Ifoci/Inucl of Mdc1 after irradiation with 5.2 Gy of 43 MeV carbon ions (A) and 4.8 Gy of 20 MeV protons (B) and 53BP1 after 7.6 Gy carbon (C) and 6.9 Gy proton irradiation (D) plotted for one cell and fitted with our model function (eq. 1). Irradiation took place on t = 0. The insets show the protein accumulation after the irradiation with splayed time-axis.

