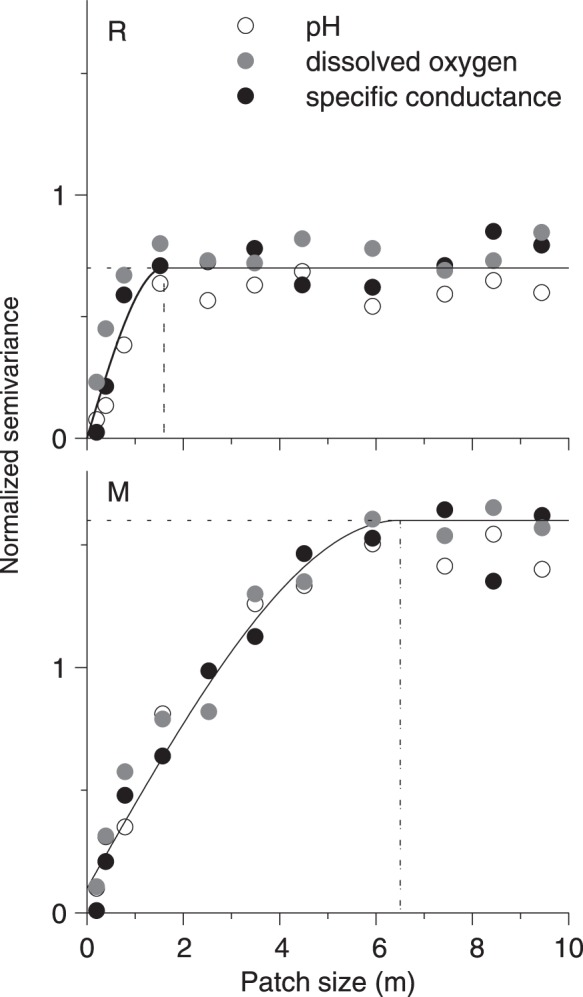
Figure 3. Geostatistical analysis: variograms of contrasting stream reaches.

Normalized semivariances of the hyporheic parameters specific conductance, dissolved oxygen and pH as a function of distance between sampling sites for two contrasting stream reaches (R and M). A spherical variogram model (solid line is only for illustration; for analysis, models were fitted individually for each parameter) quantifies the geostatistical parameters sill (here denoted patch contrast and representing the maximum value, horizontal dashed line) and range (here denoted patch size and representing the distance at which the patch contrast is reached, vertical dashed line). Markers show the mean of both sampling dates from the development data set. R = Suedliche Regnitz, M = Moosach.
