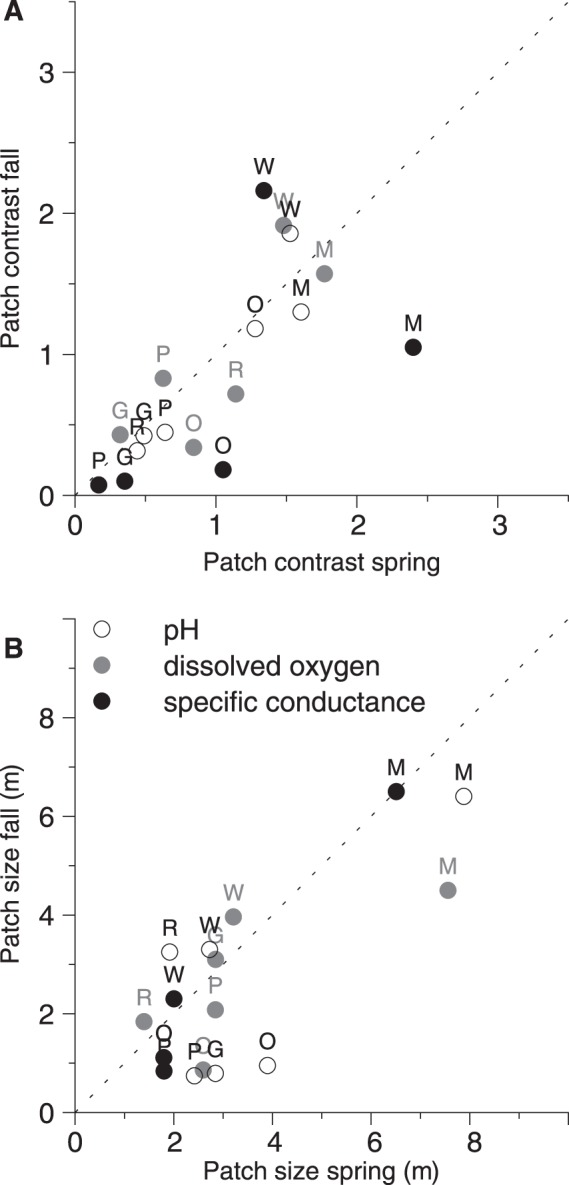
Figure 4. Results of geostatistical analysis: Patch contrasts and patch sizes.

Results of the geostatistical analysis of all stream reaches at both dates of the development data: patch contrasts (A) and patch sizes (B) of hyporheic parameters. Dashed lines (y = x) indicate no temporal variation. Patch contrast is shown as normalized value, where 1 represents the mean for each parameter. Markers are coded with a capital letter for the stream reach. M = Moosach (without validation data), W = Wiesent, G = Guenz, O = Grosse Ohe, P = Perlenbach, R = Suedliche Regnitz.
