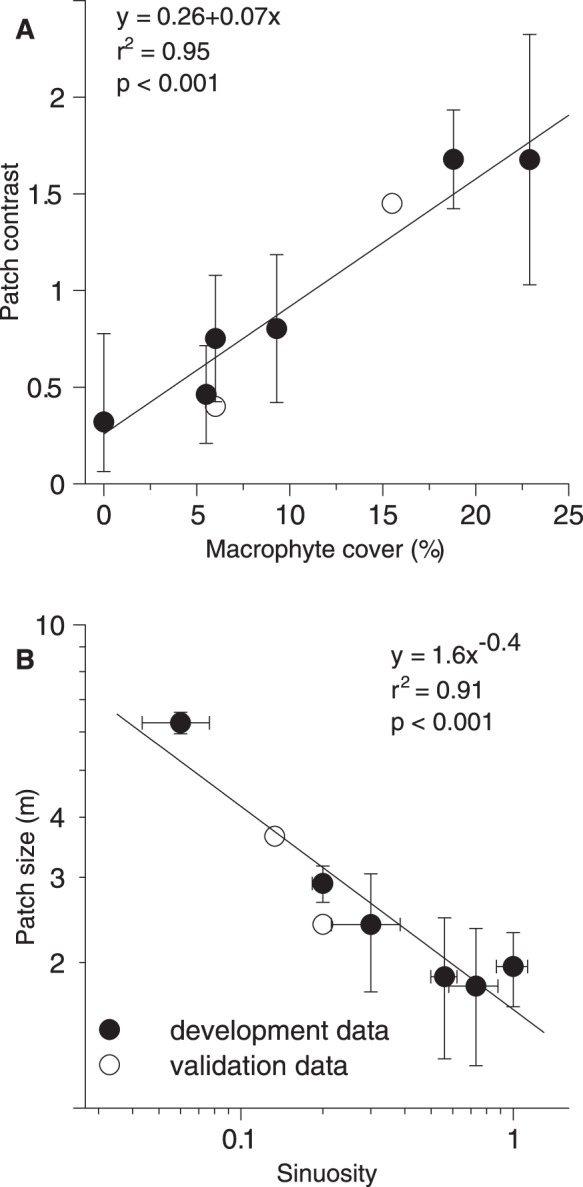
Figure 5. Models to predict patch contrast and patch size.

Correlations of normalized patch contrast of hyporheic parameters with the submerged macrophyte cover (A) and correlation of mean patch size of hyporheic parameters with the sinuosity for a 1.5 km long stretch upstream of the sampling site (B). Note the logarithmic scale for (B). Means of patch contrasts and patch sizes were calculated for each stream over both sampling dates and three (pH, specific conductance, dissolved oxygen) parameters (n = 6). Vertical bars show the respective standard deviation. Horizontal bars in (B) display the range in sinuosity for 0.5 to 2 km long stretches. Closed circles denote the development data, open circles denote the validation data. Statistics have been calculated without validation data.
