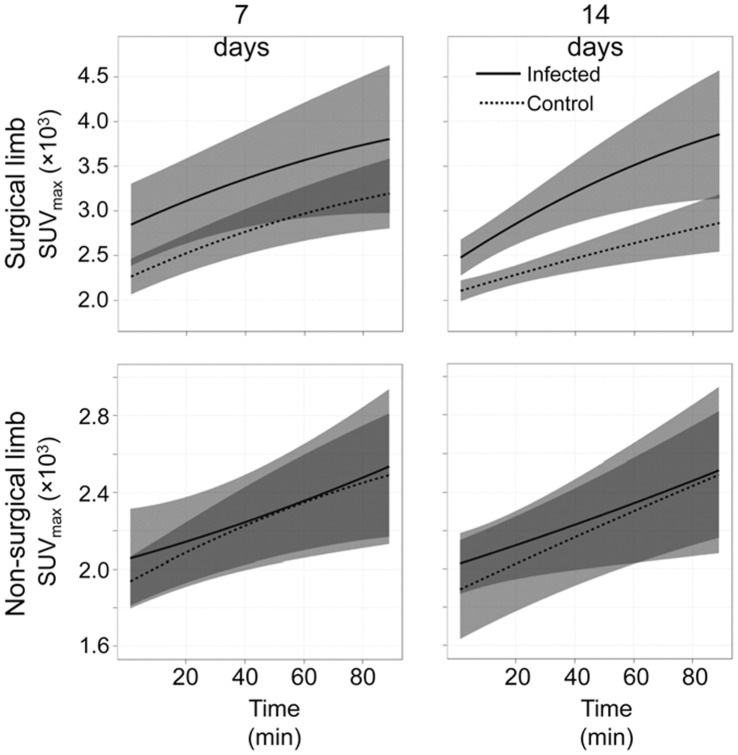
Figure 3. Uptake of FDG over time.
Uptake in the surgical (top) vs non-surgical limb (bottom) is shown for the infected and uninfected control groups as a function of time after the administration of FDG. Results for each group obtained 7 and 14 days after surgery are shown as the average SUVmax (solid line) ± one standard deviation from the mean (shaded regions). Results represent the averages ± standard deviations obtained after combining all experimental animals in the 1st and 2nd trials (see text).

