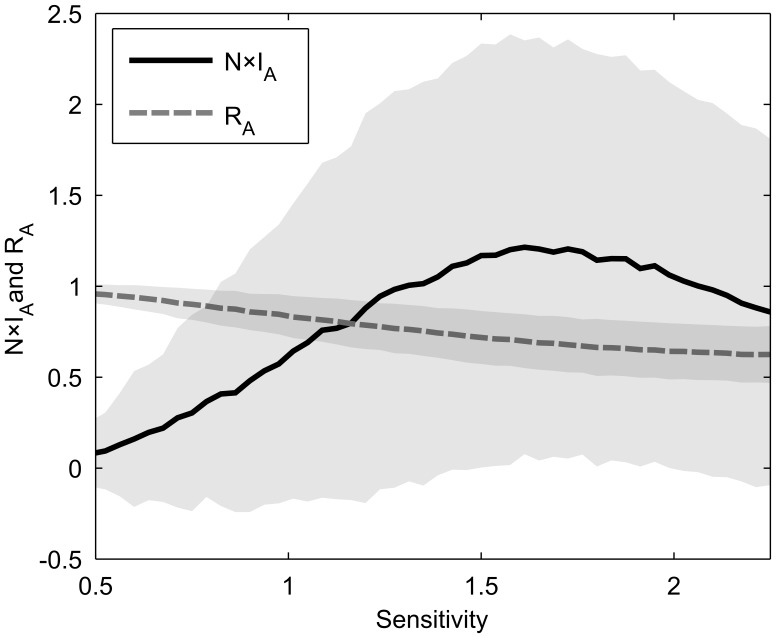
Figure 1.
 and
and  as a function of sensitivity.
N = 50, p = 0.75,  , 104 attractors were found per condition from at least 2000 networks generated randomly as described in Materials and Methods. Gray areas denote one standard deviation from the mean.

