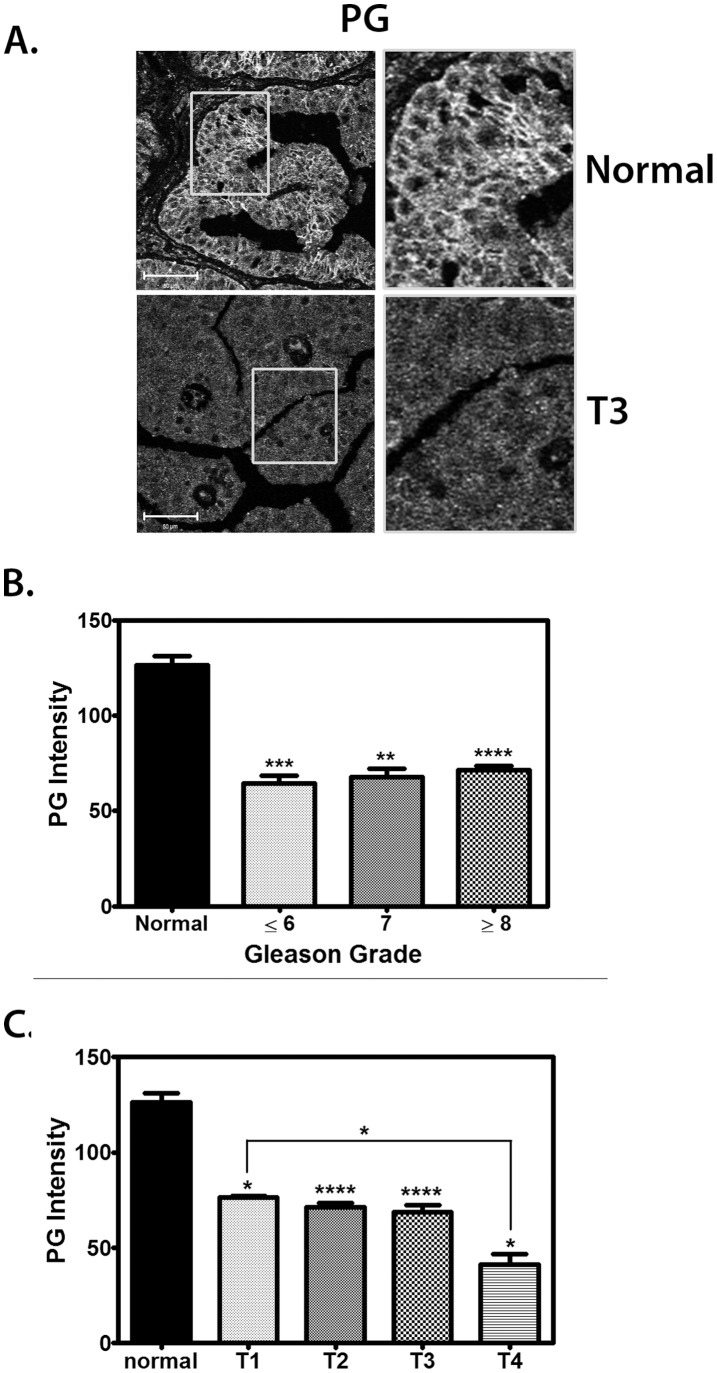
Figure 1. PG is down-regulated in invasive prostate cancer.
A–C. A prostate tissue microarray was stained with an antibody against PG. A, Representative immunofluorescence image showing PG expression in normal prostate tissue (top) and T3 (bottom) prostate tissue. Bar represents 50 µm. B. Quantification of PG expression in normal prostate tissue as compared to tissue from prostate tumors with Gleason Grade less than or equal to 6 (6 tumors), 7 (5), or greater than or equal to 8 (33). PG expression is high in normal tissue (black) and is decreased by ∼50% in tumor tissue of all Gleason grades. Gleason Grading was performed by surgical pathologist Ximing Yang. C. Quantification of PG expression in normal prostate tissue as compared to stage T prostate tumor tissue. PG is highly expressed in normal tissue (black) and expression is diminished by ∼40% in stage T1–T3 prostate tumor tissue and by almost 70% in T4 prostate tumor tissue. Tumor staging has been characterized according to the TNM scale used by UICC [35]. Primary tumor (T) staging criteria for prostate cancer was used as follows: T1, Clinically unapparent tumor (3 tumors); T2, Tumor confined within prostate (33); T3, Tumor extends through the prostate capsule (9); T4, Tumor invades adjacent structures other than seminal vesicles (3). In addition, there were 8 normal prostate tissue samples in the array. Graphs represent averages +/− SEM. *P<0.05; **P<0.002; ***P<0.0005; ****P<0.0001, by paired t test.

