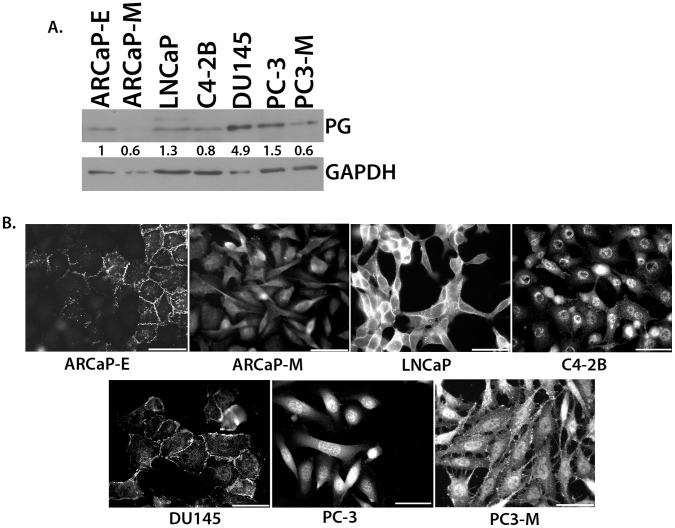
Figure 2. Expression levels and localization of PG in prostate cancer cell lines.
A. Prostate cancer cell lines were lysed and subjected to SDS-PAGE, followed by immunoblotting with antibodies against PG and GAPDH. PG levels were determined by normalizing to GAPDH levels for each cell line using Image J. The immunoblot shows that the expression of PG in prostate cancer cell lines inversely correlates with the degree of aggressiveness of the cell line. B. Prostate cancer cell lines were plated onto coverslips and allowed to attach and spread. Immunofluorescence was performed using antibodies against PG to demonstrate the localization of PG in ARCaPE, ARCaPM, LNCaP, C4-2B, DU145, PC-3, and PC3-M cell lines. The immunofluorescence shows weaker staining and a loss of cell-cell border localization of PG in the more aggressive cell lines (ARCaPM, C4-2B, and PC3-M). Representatives of at least three independent immunoblots are shown, with numbers representing GAPDH normalized PG protein levels for the blot shown. All the PG protein levels were normalized to ARCaPE levels within each blot. The average level and standard deviation of PG protein levels in panel A is as follows: ARCaPE 1.0, ARCaPM 0.3+/−0.2, LNCaP 1.5+/−0.5, C4-2B 0.5+/−0.2, DU145 3.4+/−1.2, PC-3 1.0+/−0.4, PC3-M 0.5+/−0.2.

