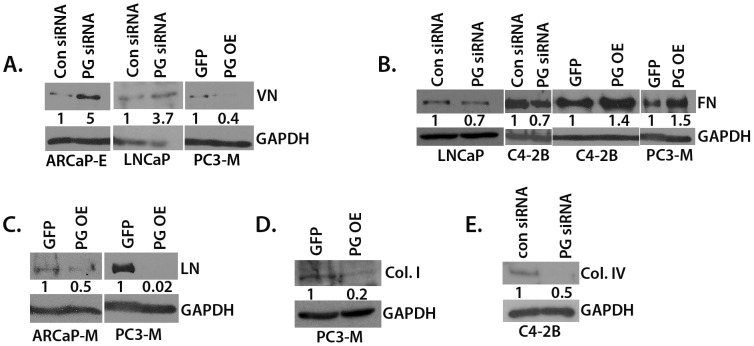
Figure 6. PG alters the profile of expression of ECM molecules in PCa cell lines.
A–E. ARCaPE, ARCaPM, LNCaP, C4-2B, and PC3-M cells were plated in 6-well plates and allowed to attach and spread. The cells were either transduced with GFP- or PG-containing adenovirus and were lysed after 24 hours (PC3-M, C4-2B, ARCaPM); or the cells were transfected with control siRNA or PG siRNA pool and after 96 hours lysed (ARCaPE, LNCaP, C4-2B). The lysates were subjected to SDS-PAGE followed by immunoblotting with antibodies against VN (A), FN (B), LN (C), Col. I (D), Col IV (E) and GAPDH. Levels of ECM proteins were determined by normalizing to GAPDH levels for each cell line using Image J. Representatives of at least three independent immunoblots are shown, with numbers representing GAPDH normalized PG siRNA/Con siRNA or PG OE/GFP ratio for the blot shown. The average ratio and standard deviation of GAPDH normalized PG siRNA/Con siRNA and PG OE/GFP is as follows: (A) ARCaPE 3.1+/−1.3, LNCaP 2.0+/−0.9, PC3-M 0.3+/−0.1; (B) LNCaP 0.7+/−0.05, C4-2B KD 0.8+/−0.1, C4-2B OE 1.2+/−0.2, PC3-M 1.5+/−0.05; (C) ARCaPM 0.6+/−0.1, PC3-M 0.4+/−0.3; (D) 0.3+/−0.1; (E) 0.4+/−0.2.

