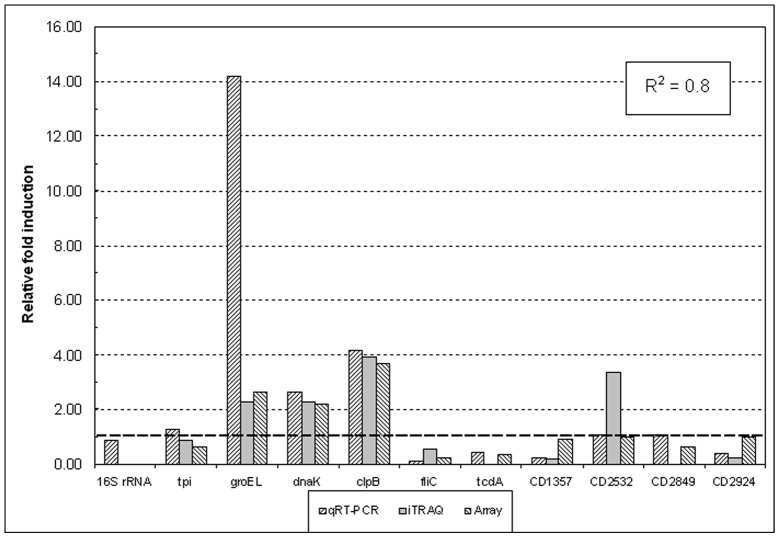
Figure 3. Comparison of qRT-PCR, iTRAQ proteomics and microarray data for selected Clostridium difficile strain 630 genes.
For each individual gene, expressional fold-change values (up-hatched columns) are shown relative to the 37°C control. Corresponding iTRAQ fold-changes (gray columns) are included for comparison with microarray data (down-hatched columns) and show good correlation between the three data sets. 16S rRNA, tpi, and CD2849, whose expression did not change by more than 1.5-fold, were used as reference genes.

