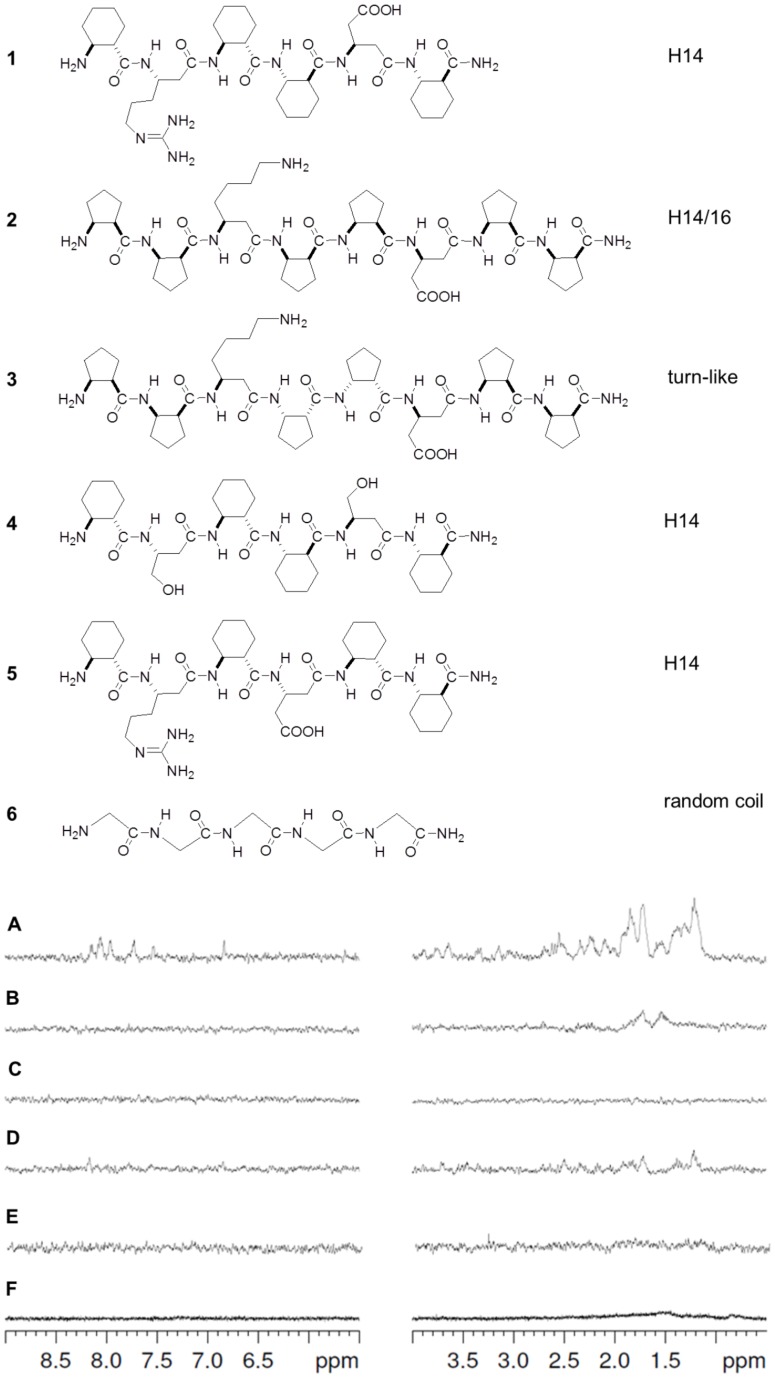
Figure 2. Screening for the foldameric recognition segments.
Informative regions of the STD spectra (A–F for 1–6, respectively) in the presence of Aβ(1–42) oligomers. The spectra were recorded in 20 mM phosphate buffer at pH 7.4, the total concentration of the Aβ(1–42) was 72 μM, and the ligands were applied at 2 mM. The secondary structure type is indicated to the right of the structures. ‘H’ stands for helix, and the numbers show the size of the H-bonded pseudocycles stabilizing the helices.

