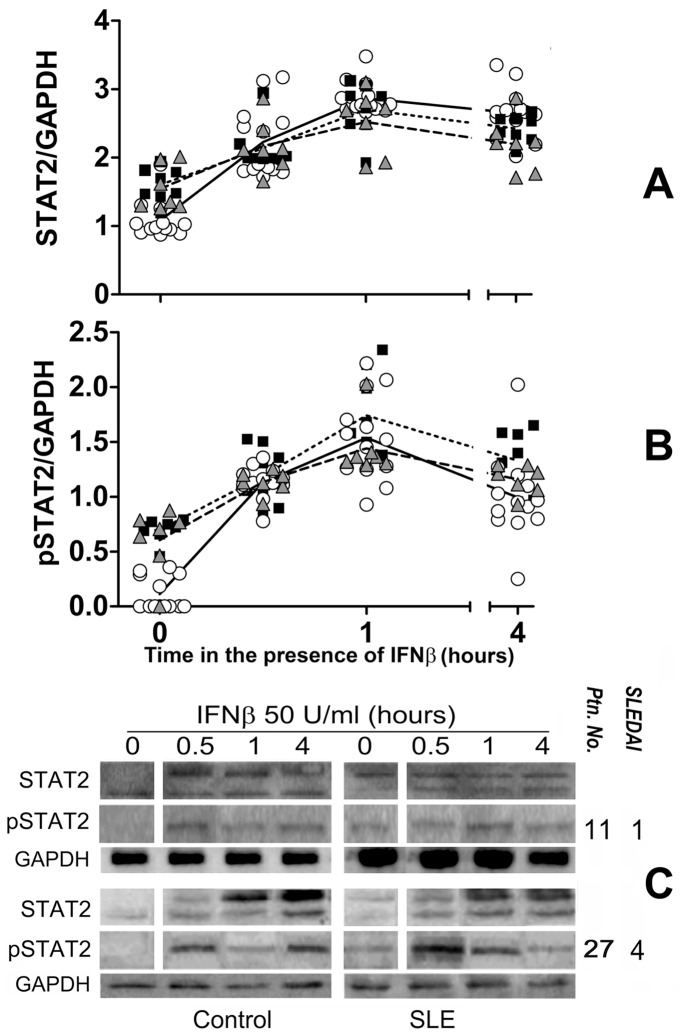
Figure 2. Constitutive phosphorylation of STAT2 in SLE.
A and B, densitometric values of: STAT2/GAPDH and pSTAT2/GAPDH ratios, respectively, of PBMC protein extracts from SLE patients (n = 15, closed squares and triangles) or the same number of healthy controls (open circles) before (time 0) and at different lengths of culture after the addition of 50 U/ml human recombinant IFNβ. Inactive SLE (triangles) includes patients with SLEDAI 0 and active SLE (squares) comprises patients with SLEDAI≥1. C. STAT2 western blot samples of 2 patients (right) with their respective activity scores (SLEDAI) and healthy controls (left).

