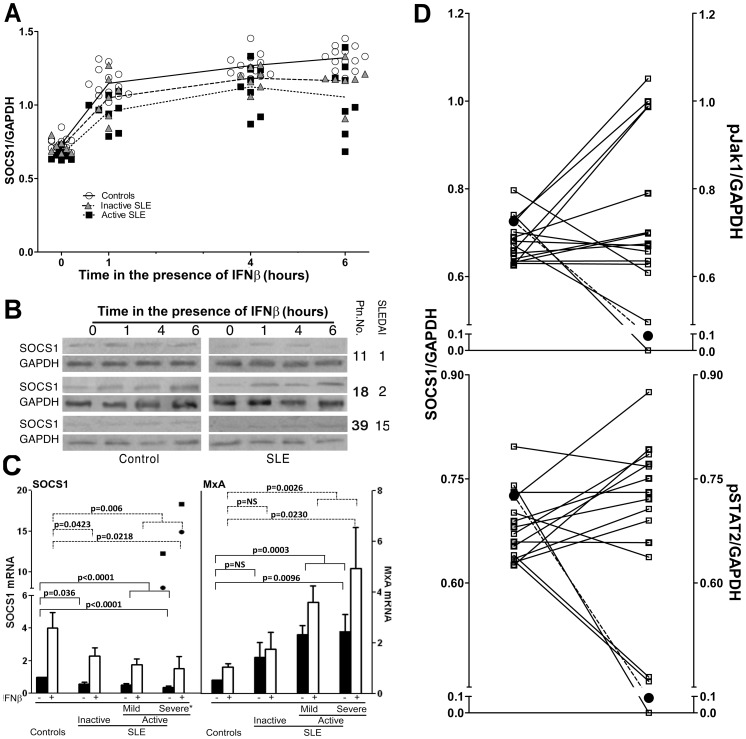
Figure 5. Decreased expression of SOCS1 protein and mRNA in SLE and its relation to Jak1 and STAT2 phosphorylation.
A. Densitometic values of SOCS1 western blots in SLE or healthy controls (open circles) before (time 0) and at different lengths of culture after the addition of 50 U/ml human recombinant IFNββ. Triangles = inactive SLE (SLEDAI 0), squares = active SLE (SLEDAI≥1). B. Representative Western blot samples of 6 patients (right) with their respective activity scores (SLEDAI) and healthy controls (left). C. Real time RT-PCR achieved with total RNA from SLE (n = 31) or an equal number of healthy control PBMC before (black bars) or after (white bars) 30 min of culture in the presence of 50 U/ml IFNβ. Expression of SOCS1 is depicted on the left panel and MxA on the right. Inactive SLE = SLEDAI 0 (n = 9), active mild = SLEDAI 1–4 (n = 12) and active severe = SLEDAI>4 (n = 10). Statistical values were obtained by Student’s t test for non-paired samples. The two points shown in the SOCS1 bars above the severely active patients correspond to the only ones with increased SOCS1 expression and are not included within the corresponding bars and were not included for statistics (see text). D. Individual comparisons of basal levels of SOCS1 (left) to pJak1 (top) and pSTAT (bottom) of individual SLE patients (n = 15), represented as open squares. The mean values of healthy controls (n = 15) are represented as black circles.

