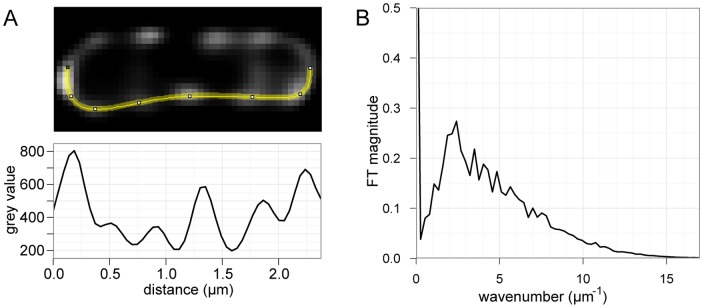
Figure 2. Fourier analysis reveals periodicity of GFP-VirB8 foci.
A, example GFP-VirB8 expressing cell with the lower edge highlighted, with corresponding fluorescence profile plot used in subsequent analyses. B, Combined Fourier transforms of each standardized fluorescence profile from 152 cell-sides. The Fourier transform peaks between k = 1.88 and k = 2.42, indicating the presence of a periodic element with a peak period of 0.41–0.53 µm.

