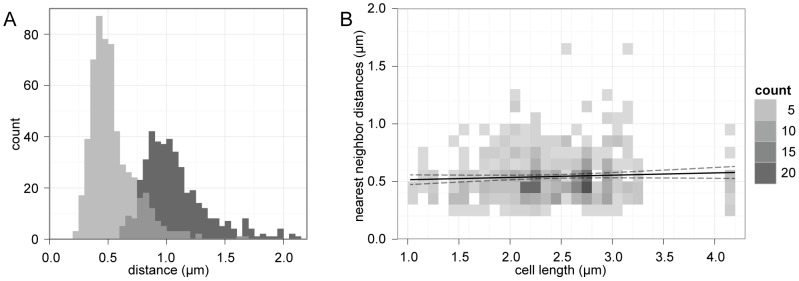
Figure 3. Nearest neighbor distributions of GFP-VirB8 foci.
A, GFP-VirB8 foci distances from 76 cells shown as two superimposed histograms of peak to peak distances between nearest neighbor peaks (light grey) and next nearest neighbors (dark grey), with overlap in grey. Bin size is 0.05 µm. B, heat map of VirB8 nearest neighbor distances versus cell length. A linear model fit (black line) with 95% confidence intervals (dashed lines) show little correlation between cell length and foci spacing.

