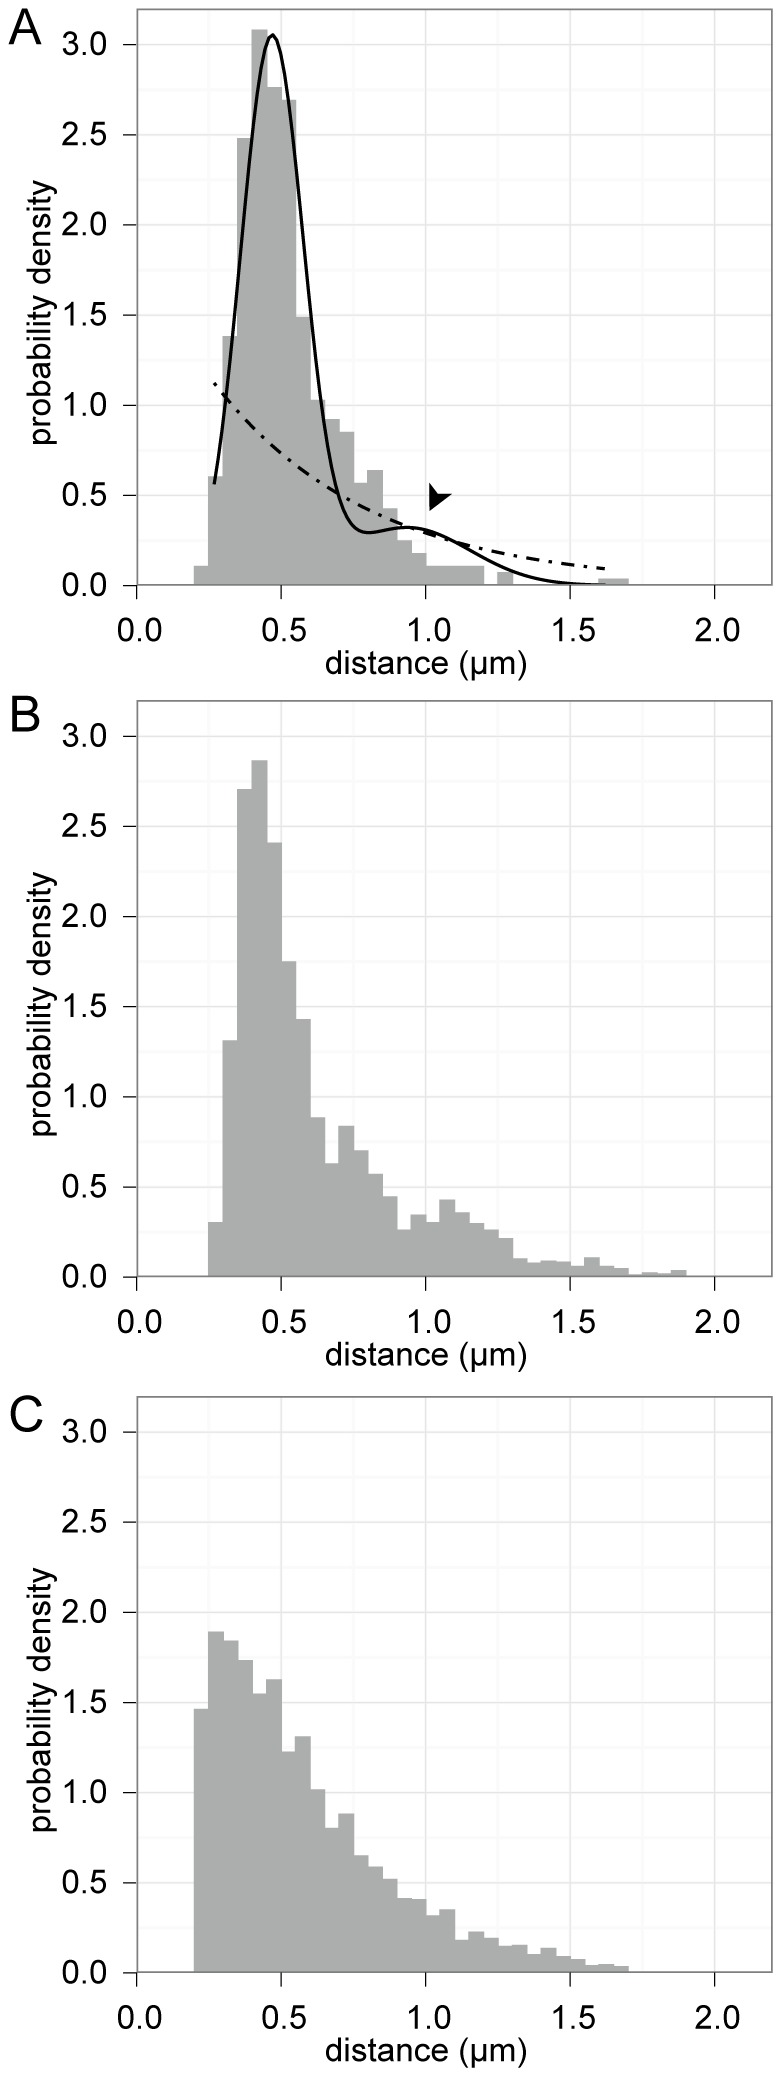
Figure 4. Maximum likelihood modeling and Monte Carlo simulations support periodic placement.

A, density histogram of nearest neighbor distances for VirB8 overlayed with maximum likelihood best-fit models of periodic (—) and random (- • -) placement. Arrowhead indicates secondary peak of periodic model. B and C, density histograms of nearest neighbor distances gathered from Monte Carlo simulations of periodic helical (B) and random (C) placement.
