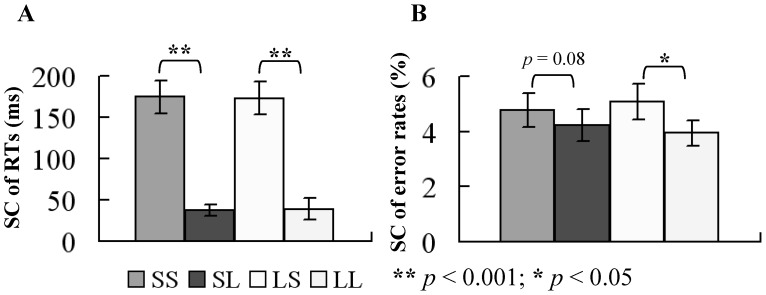
Figure 4. Behavioral switch cost.
(A) Average switch costs of behavioral reaction time are shown for the 14 subjects in the four conditions. Switch cost was smaller in the long CSI condition. (B) Average switch costs of behavioral error rates are shown for the 14 subjects in the four conditions. Subjects responded more accurately in the SL and LL conditions (long CSI condition). Switch cost was smaller in the long CSI. Error bars show SEM.

