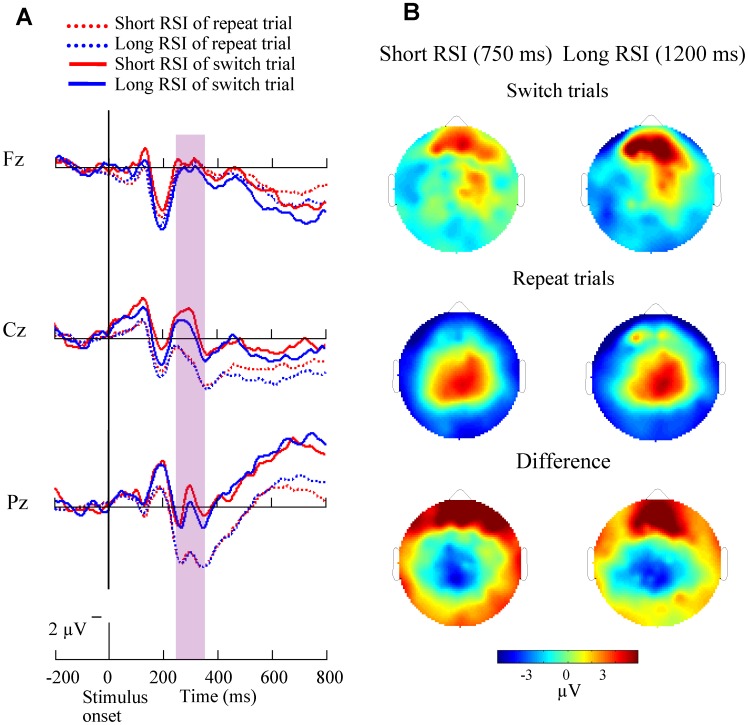
Figure 9. Stimulus-related ERP waveforms and brain topographies on long CSI condition.
(A) Grand-average stimulus-related ERP waveforms at midline sites (Fz, Cz, Pz) are shown for the 14 subjects in long CSI conditions across both repeat and switch trials. In all the repeat and switch trials, a slow central and parietal negativity emerged at about 300 ms after stimulus onset. (B) Brain topographies in the long CSI conditions across repeat (mid) and switch trials (top) and the difference topographies between switch and repeat trials (bottom) are shown.

