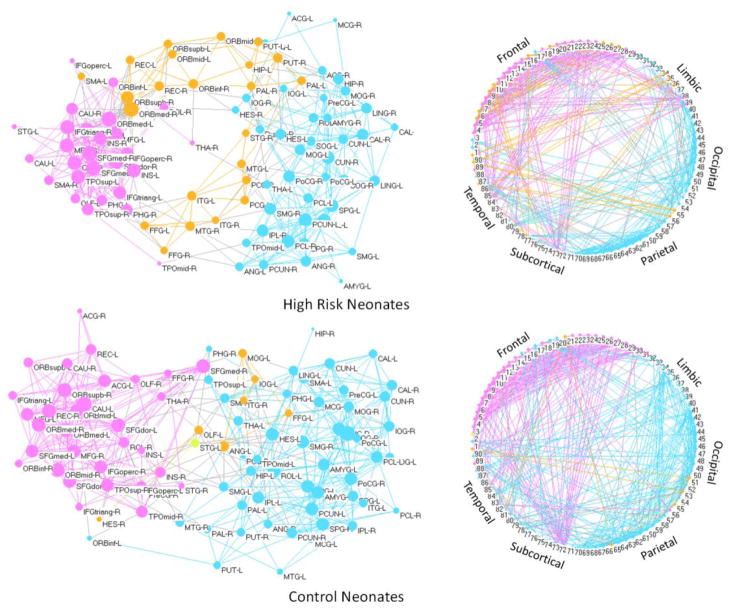
Figure 5.
Left panel shows the spring-embedded visualization of the morphological networks. Nodes are color-coded based on different modules. Intra-module edges are color-coded as the same color with the nodes. Gray edges connect inter-modules. Right panel shows circular visualization of the networks, where the nodes are arranged clockwise based on their indices, dividing them into 6 major lobes: frontal, limbic, occipital, parietal, subcortical, and temporal lobes. Note that all subjects in each population are used to construct the network, and the network sparsity is set as 12%.

