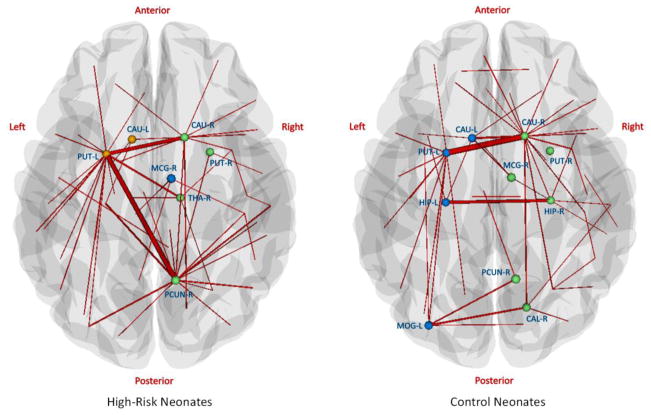
Figure 8.
Hub nodes and edges for white matter networks of high-risk neonates (left) and control neonates (right). Hub nodes are denoted as spheres and the colors represent different modules. Thicker edges indicate larger betweenness values, implying that they are traversed more frequently. Note that the two ends of the hub edges are not necessarily hub nodes, and non-hub nodes are not shown in the figure.

