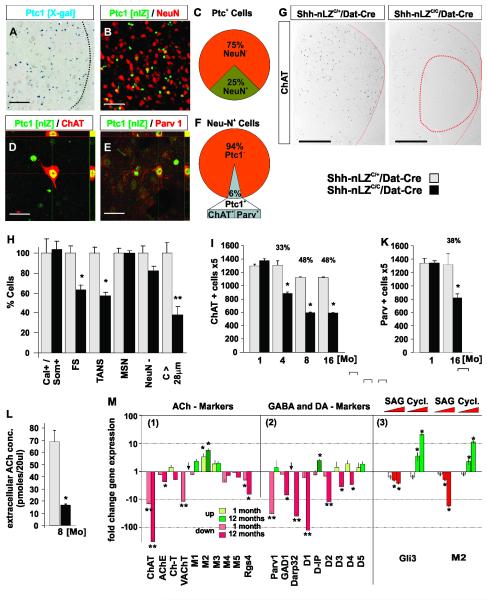
Figure 5. Neuronal subtype specific and progressive degeneration in the striatum in absence of Shh signaling from mesencephalic DA neurons.
(A) X-Gal labeled coronal section of striatum of a Ptc1-nLZ mouse.
(B) Ptc1 expression in neuronal and non-neuronal cells of the striatum.
(C) 25 +/− 5.2 % of Ptc1+ striatal cells are neurons (n=612 cells, 3 mice).
(D) Ptc1 expression in striatal ACh neurons.
(E) Ptc1 expression in striatal FS- neurons.
(F) 6 +/− 2.2 % of striatal neurons express Ptc1 (n=420 cells, 3 mice); 100 +/− 0 % of ACh-neuron express Ptc1 (n=140 cells, 3 mice); 98 +/− 2.0 % of FS-neurons express Ptc1 (n=150 cells, 3 mice).
(G) Loss of Ach-neurons is most pronounced in lateral areas of the dorsal striatum (circled in red) in Shh-nLZC/C/Dat-Cre mice.
(H) Quantification of striatal cell types by heterochromatin pattern (Figure S6A, B) and nuclear size (Figure S6C) in Shh-nLZC/C/Dat-Cre. (*p < 0.05, **p < 0.001, t-test (10 striatal slices/subject, n=7 mice per genotype).
(I) Progressive reduction in the numbers of ChAT+ neurons in the striatum in Shh-nLZC/C/Dat-Cre mice (p < 0.05, unpaired t-test (n=6-7/group, 12 sections per subject with a 5 section interval).
(K) Progressive reduction in the numbers of Parv+ FS neurons in the striatum in Shh-nLZC/C/Dat-Cre mice. (*p < 0.05, unpaired t-test (n=4/group, 12 sections per subject with a 5 section interval).
(L) Reduced extracellular ACh concentration in the striatum in 8 month old Shh-nLZC/C/Dat-Cre mice (** p < 0.001, unpaired t-test (n = 8/genotype, 4 samples/subject).
(M) Quantification of changes in gene expression in the striatum of 4 weeks and 12 months old Shh-nLZC/C/Dat-Cre mice (1 & 2) and after unilateral injection of increasing concentrations of SAG or cyclopamine (* p < 0.01, ** p < 0.001, two tailed t-test; n=5/genotype or treatment).

