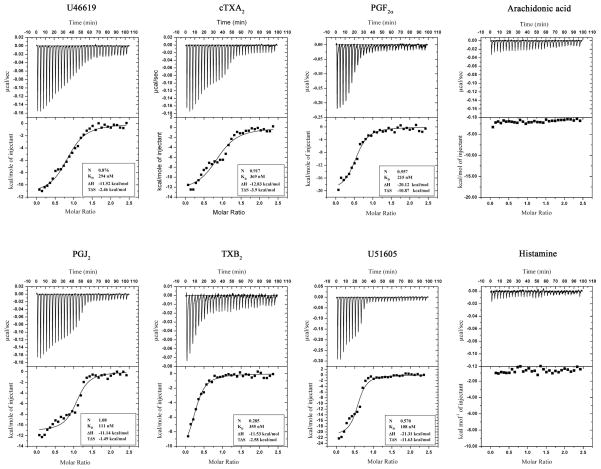
Fig. 3. Isothermal titration calorimetry.
Upper panels: base line-adjusted heats per injection of different ligands (40 μM) into triplatin (4.0 μM). The lower panels indicate the molar enthalpies per injection for ligand interaction with triplatin. Filled squares measured enthalpies; solid line, fit of experimental data to a single site binding model. Thermodynamic parameters: ΔH in kcal/mol, TΔS in kcal/mol, and KD are indicated in the inset for each ligand. Experiments were repeated at least 2 times for each ligand.

