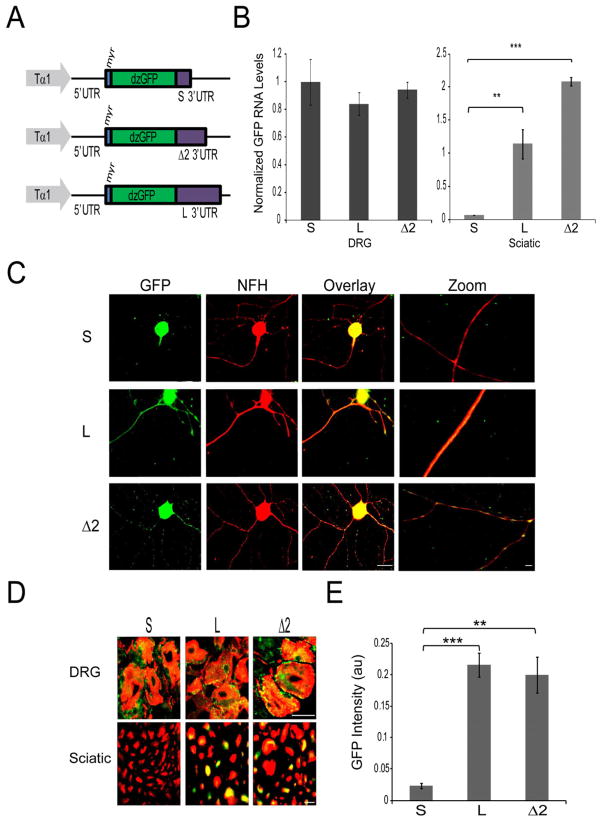
Figure 3. Validation of the importin β1 axon localization region in transgenic mice.
(A) Schematic of DNA constructs used to generate transgenic mice. The neuronal specific Tα1 tubulin promoter was used to drive expression of a destabilized myristylated GFP fused to the 5′UTR of Importin β1, and different variants of Importin β1 3′UTR as indicated.
(B) Quantitative RT-PCR for GFP mRNA from adult transgenic mouse tissue extracts. β actin served as an internal control. Left – GFP mRNA levels in DRG from the different transgenic lines, normalized to short 3′UTR line; Right – GFP mRNA levels in sciatic nerve from the different transgenic lines, normalized to DRG levels for each line.
(C) Cultured adult sensory neurons from transgenic 3′UTR reporter mice (S, L, and Δ2 lines) after 48 hr in vitro. Robust GFP levels (green) are seen in neuronal cell bodies and in axons for the long and Δ2 UTR lines, but only in the cell body for the short 3′UTR line. Scale bar 20 μm, scale bar zoom panels 10 μm.
(D) Merged images of GFP (green) and immunostaining for NF-H (red) on DRG and sciatic nerve sections from short, long and Δ2 transgenic lines seven days following sciatic nerve crush. For individual channel images please see Supplementary Figure S4. Axonal GFP signals are clearly observed in sciatic nerve sections from the long and Δ2 transgenic lines, but not from the short UTR line, despite equivalent expression in neuronal cell bodies in ganglia sections. Scale bar 10 μm.
(E) Quantification of GFP intensity levels (au, arbitrary units) in sciatic nerve sections from short, long and 3′ terminal segment (Δ2) using CellProfiler image analysis software (average ± SEM) •• denotes p < 0.01, ••• denotes p < 0.001.

