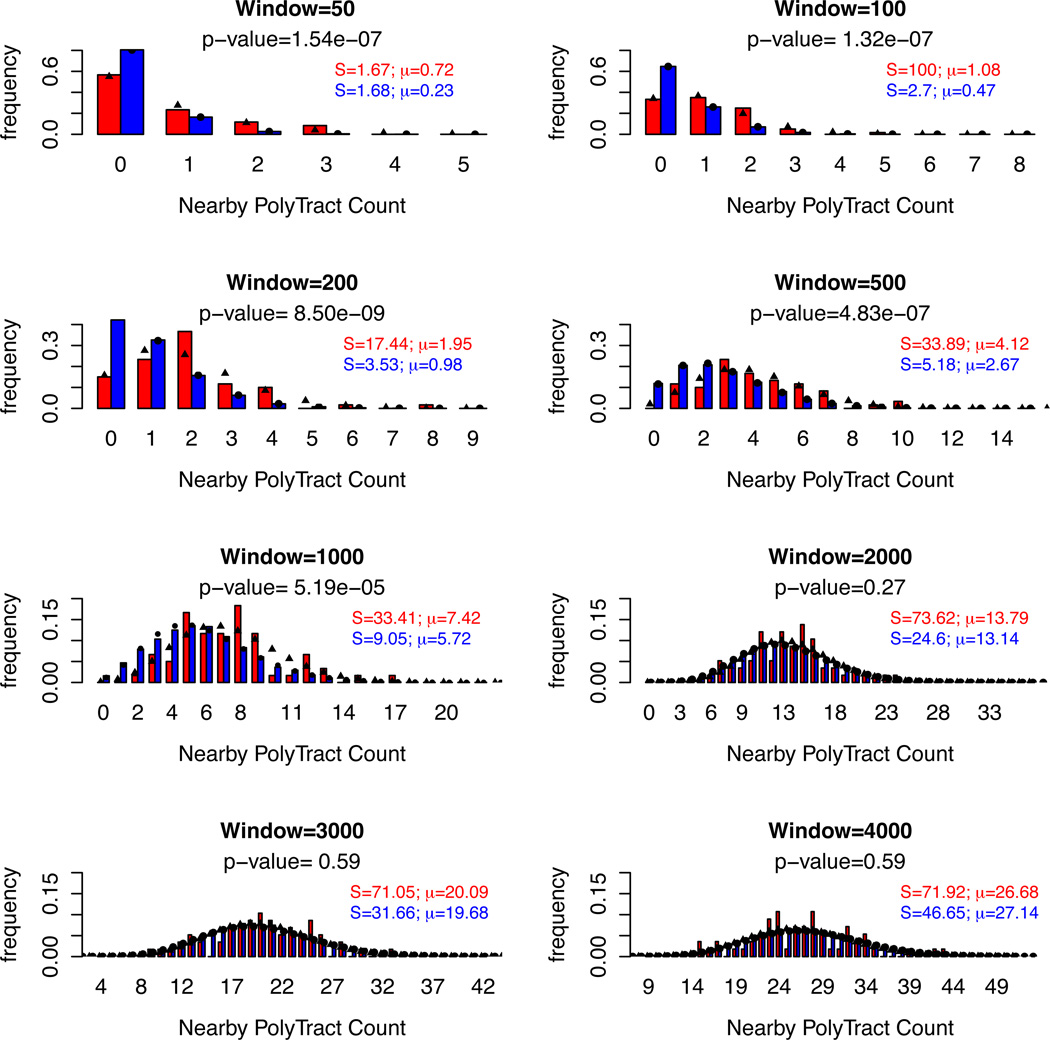
Fig. 2. Sliding window analysis for in-del mutations in poly(dA:dT) tracts in the Mut4 line.
The number of 5–14 nt poly(dA:dT) tracts was counted under different window sizes (50–4000 bp). This was determined for windows centered on poly(dA:dT) tracts with (red) and without (blue) an in-del mutation. The center sites were excluded from the counting analysis. The X-axis displays the number of poly(dA:dT) tracts contained within each window. The Y-axis shows the frequency for which each poly(dA:dT) tract was observed. The fitted size (S) and mean (µ) for each of the two distributions in a fixed window size is listed. The P-value of the likelihood-based method used to compare the means of two Negative Binomial distributions (Aban, 2008) is shown for each window (Experimental Procedures).

