Figure 1.

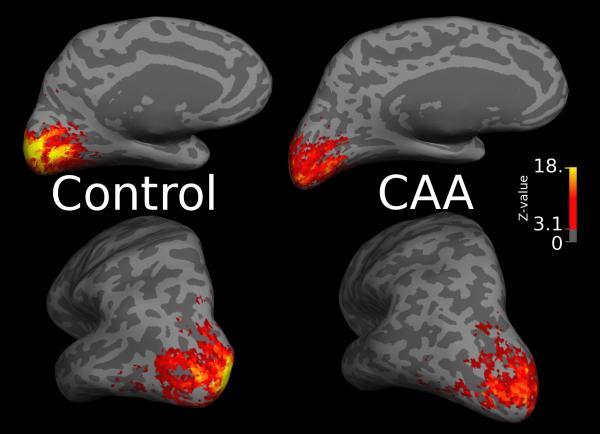
Visually activated region of interest. Figure 1a shows the functional ROI on the left hemisphere inflated mid-gray cortical surface (darker grayscale values represent sulci). Figure 1b shows functional activation on the inflated mid-gray surface of the left hemispheres of a representative control (left) and CAA (right) subject. The color scale denotes the Z-statistic for activation using the canonical hemodynamic response function (see Methods); Z>3.1 corresponds to the level of significance (p<0.001) used to create the functional ROI. There is apparent decreased strength of activation of the CAA subject compared to the control.

