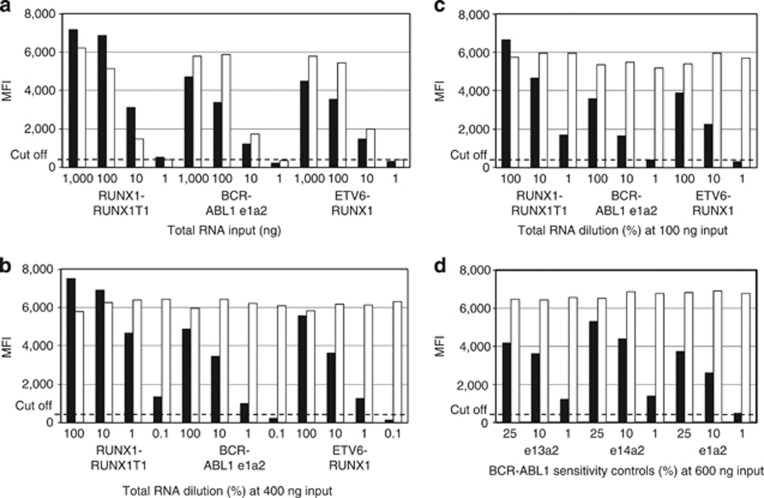
Figure 2.
Evaluation of analytical sensitivity. (a) Total RNA purified from the indicated translocation-positive cell lines was tested with the MMA at 1000, 100, 10 or 1 ng per RT reaction. (b) The same total RNA samples were tested either undiluted (100%) or diluted at 10, 1% or 0.1% in a background of total RNA isolated from the translocation-negative cell line HL60 at a final input of 400 ng per RT reaction. (c) Same experiment as in (b) at 100, 10 or 1% dilution and 100 ng input. (d) BCR–ABL1 sensitivity controls tested in duplicate with the MMA at 600 ng input. The graphs show the average MFI signals generated by the target-specific probes (black bars) and by the GAPDH endogenous control probe (white bars) relative to the 350 MFI cutoff value (dash lines). The complete data set is presented in Supplementary Table 2.

