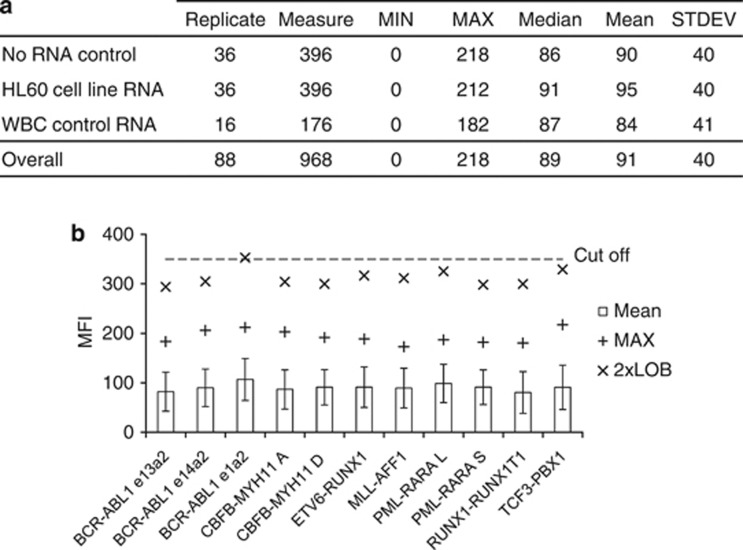
Figure 4.
Limit of blank study. (a) Summary of the MFI probe signals obtained from repeat testing with the MMA of a no RNA control sample, a total RNA sample purified from the translocation-negative HL60 cell line, and eight total RNA samples purified from asymptomatic control donors' white blood cells (WBC control RNA). Minimum (MIN), maximum (MAX), median, mean and s.d. (STDEV) values for the 11 fusion-transcript-specific probes combined are shown for each sample type and overall. (b) Results by probe type for all sample types combined. The graph shows the mean, maximum (MAX) and twice the limit of blank (2 × LOB) values for each of the 11 fusion-transcript-specific probes relative to the qualitative 350 MFI cutoff value (dash line). The error bars represent the s.d. of each probe-specific distribution. The complete data set is presented in Supplementary Table 2.

