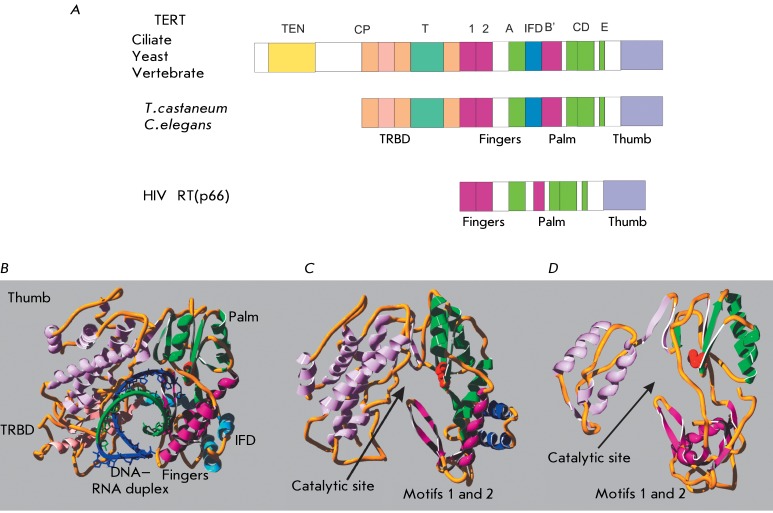
Fig. 3.
Structure of telomerase reverse transcriptase. A – Schematic representation of the domain organization of TERT in different organisms and HIV reverse transcriptase. Homologous domains are shown in color. B – Spatial structure of the T. castaneum TERT complex and the RNA–DNA duplex. The image was obtained using the PDB file 3KY. C – Spatial structure of T. castaneum TERT. The image was obtained using the PDB file 3DU5. D – Spatial structure of HIV RT. The image was obtained using the PDB file 1N6Q. Asn residues of the enzyme catalytic sites are shown in red.

