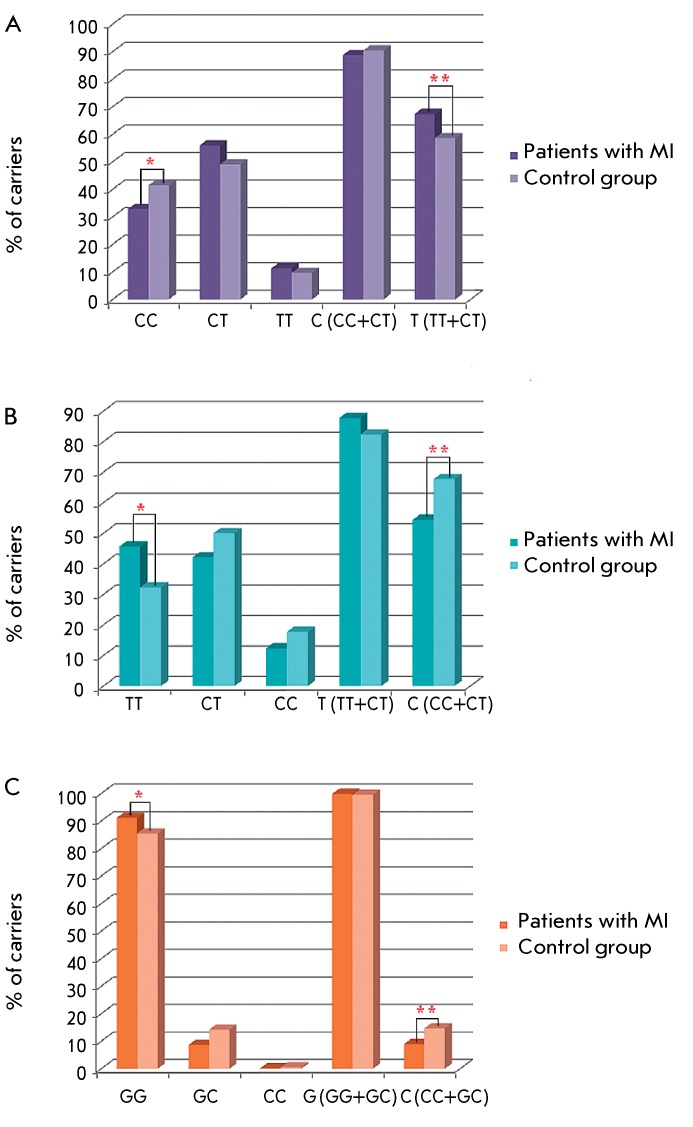
Fig. 1.
Carriage frequencies of alleles and genotypes of TGFB1 gene polymorphous lociin the patients with MI and in the control group. A, SNP –509C>T. * p = 0.046, OR = 0.69; ** p = 0.046, OR = 1.45; B, SNP 869T>C. * p = 0.0024, OR = 1.75, ** p = 0.0024, OR = 0.57; C, SNP 915G>C. * p = 0.048, OR = 1.76; ** p = 0.048, OR = 0.57.

