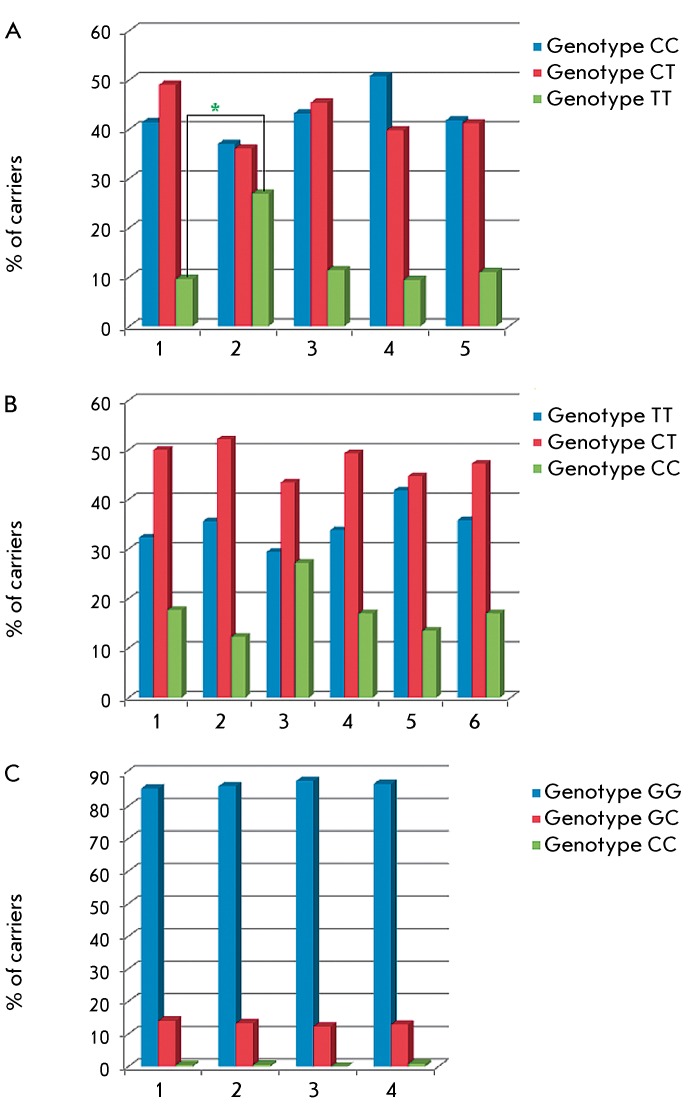
Fig. 2.
Carriage frequencies of genotypes of the TGFB1 gene polymorphous loci in different Caucasian populations. A, SNP –509C>T. 1 – Russia, control group in the present study, 2 – Italy [6], 3 – Germany [5], 4 – UK [14], 5 – ECTIM study (France + Northern Ireland) [1]; B, SNP 869T>C. 1– Russia, control group in the present study, 2 – Russia, men [17], 3 – Italy [6], 4 – Germany [5], 5 – England [14], 6 – ECTIM study (France + Northern Ireland) [1]; C, SNP 915G>C. 1 – Russia. Control group in the present study, 2 – Germany [5], 3 – UK [14], 4 – ECTIM study (France + Northern Ireland) [1]. * - p = 0.001.

