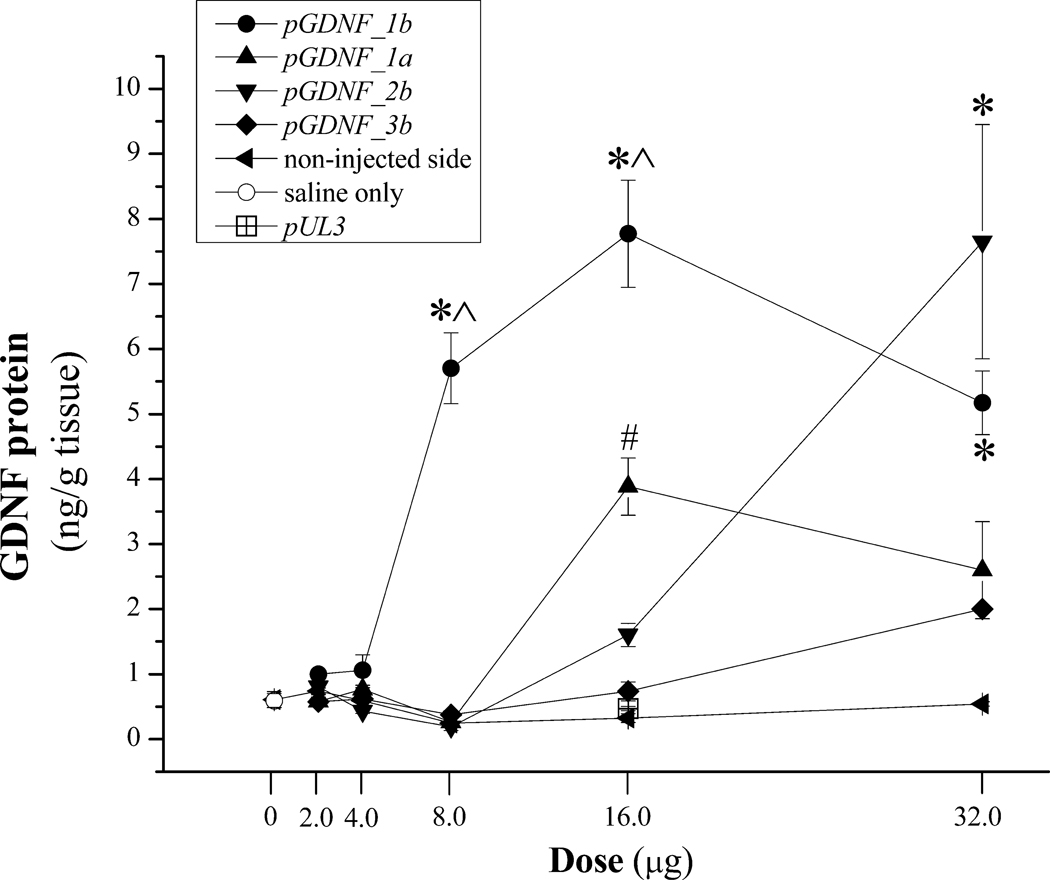
Figure 3.
Dose-response study for intracerebral injections of DNPs containing pGDNF_1a, pGDNF_1b, pGDNF_2b, or pGDNF_3b. Various doses of DNPs containing 1 of the 4 plasmids were injected in equivalent volumes (8.0 µl) of sterile saline into the left striatum. One week after DNP injection GDNF protein was measured in the injected or non-injected striatum using ELISA, and each point on the graph represents the mean (± s.e.m.; n=5) of GDNF protein for each plasmid at each dose. There is only one point for two control conditions: saline (8.0 µl; n=5) and pUL3 (16.0 µg; n=5); pUL3 is a plasmid encoding for luciferase and does not encode for GDNF. *p<0.05 vs. pGDNF_1a, pGDNF_3b, non-injected side; ^p<0.05 vs. pGDNF_2b; #p<0.05 vs. pGDNF_2b, pGDNF_3b, non-injected side.

