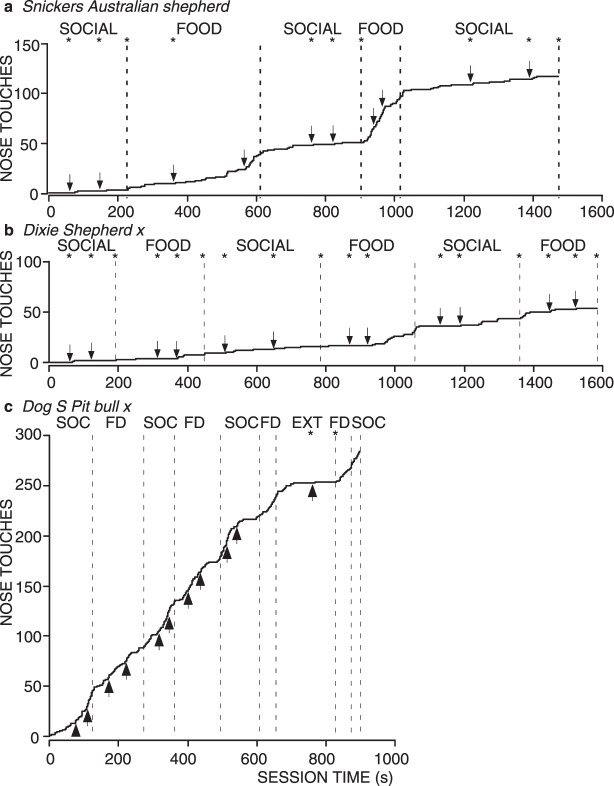
Fig. 2.
Cumulative records for all sessions for 3 individual shelter dogs from Experiment 1, each corresponding to one of three patterns of responding our study revealed. Time during reinforcer delivery was subtracted, leaving a cumulative record of time from stimulus onset to response. The dashed vertical lines show when conditions changed (condition type noted at the top of each graph). Arrows show where each individual session ended. Asterisks at the top of the graph indicate when a session ended before the dog emitted all 15 possible nose touches (i.e., the dog stopped responding for at least 1 min). Graph a shows the most common pattern of responding (short latencies in the Food condition and long latencies in the Social condition). Graph b shows the next most common pattern of responding (low and variable responding in both conditions). Graph c shows the pattern of responding for Dog S, who was unique in our study for responding equivalently to food (FD) and social interaction (SOC) consequences.

