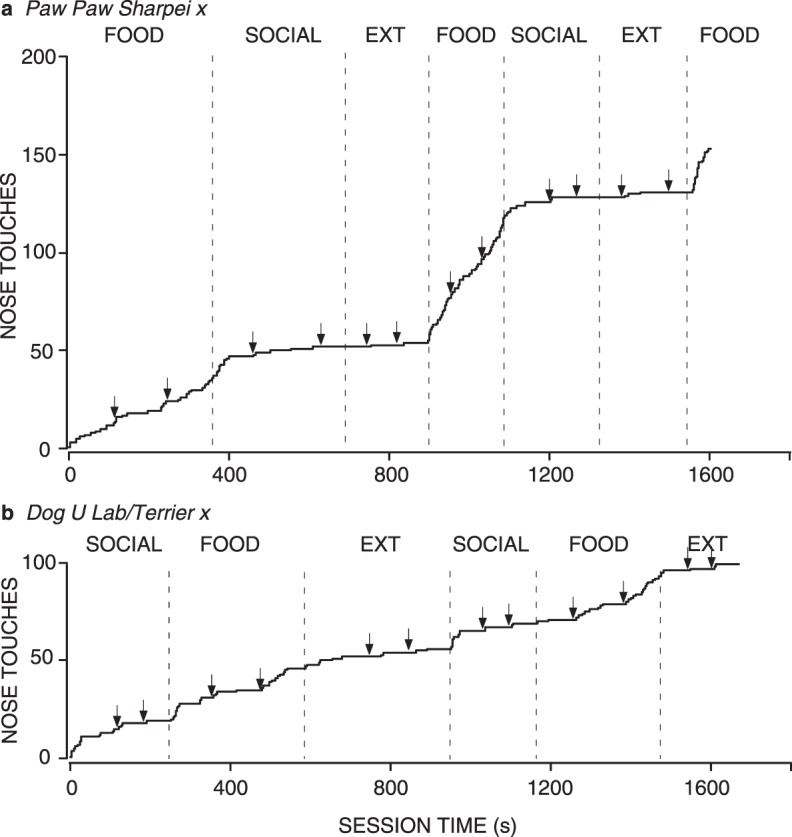
Fig. 5.

Cumulative records for all sessions for 2 individual shelter dogs from Experiment 2, both corresponding to the most common pattern of responding our study revealed. Other details are the same as for Figure 2. Graph a shows the most common pattern of responding (short latencies in the Food condition and long latencies in the Social condition). Graph b shows the next most common pattern of responding (low and variable responding in both conditions).
