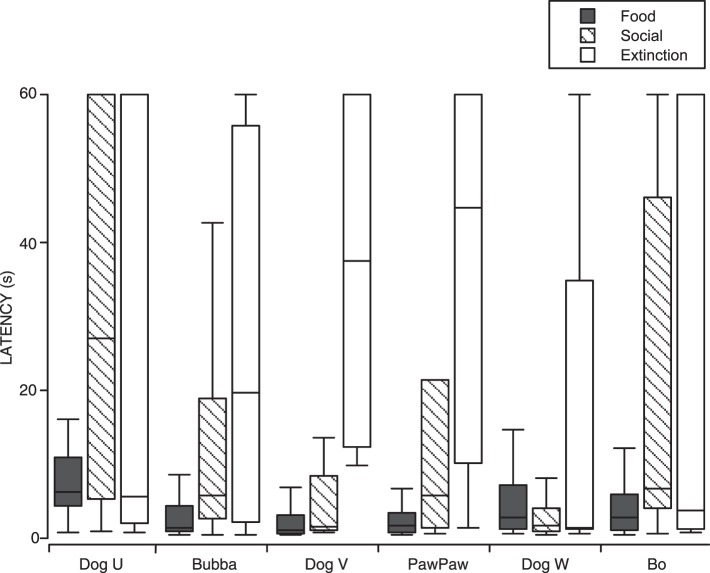
Fig. 6.
Medians and interquartile ranges of the latencies to respond for shelter dogs in Experiment 2. The data graphed are the latencies from the last complete Food (dark gray), Social (diagonal hatching), and Extinction (white) conditions for each dog (i.e., three sessions of each condition). Other details are the same as for Figure 3.

