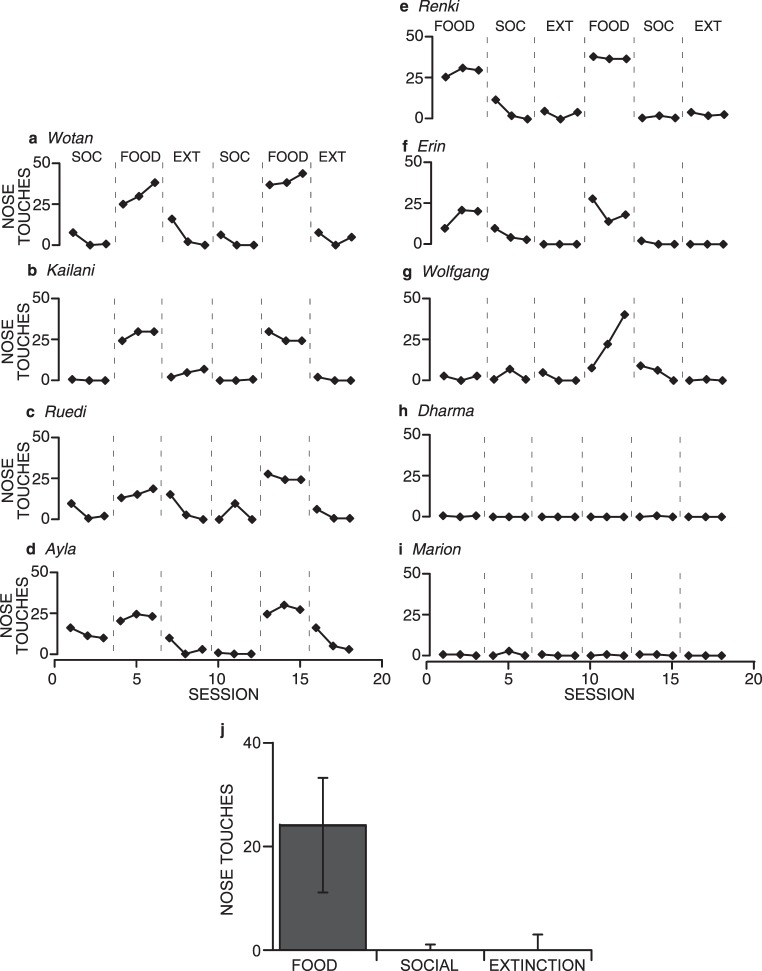
Fig. 11.
Total number of nose touches emitted by hand-reared, captive wolves in each session under Food, Social (SOC), and Extinction (EXT) conditions (a-i). Wolves that experienced the Social condition first are graphed on the left; wolves that experienced the Food condition first are graphed on the right. Graph j shows the medians and interquartile ranges of the total number of nose touches per session emitted by all wolves. Other details are the same as for Figure 4g.

