
Fig. 1.
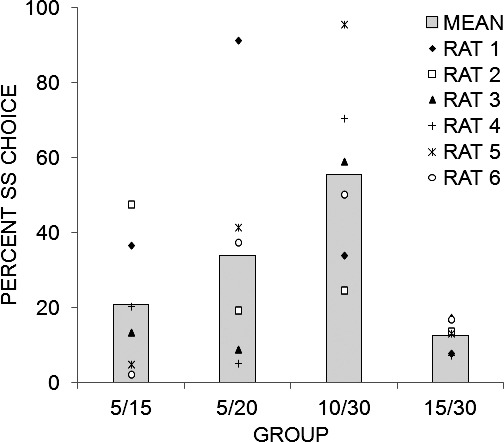
Mean (and individual rat) percentage of choices made to the SS lever for each of the four different groups of rats. Groups are labeled according to the SS and LL duration received during training in Experiment 1. Note that the rats within each group are different animals as this was a between-subjects design (e.g., Rat 1 in Group 5/15 is a different animal from Rat 1 in Group 5/20).