
Fig. 2.
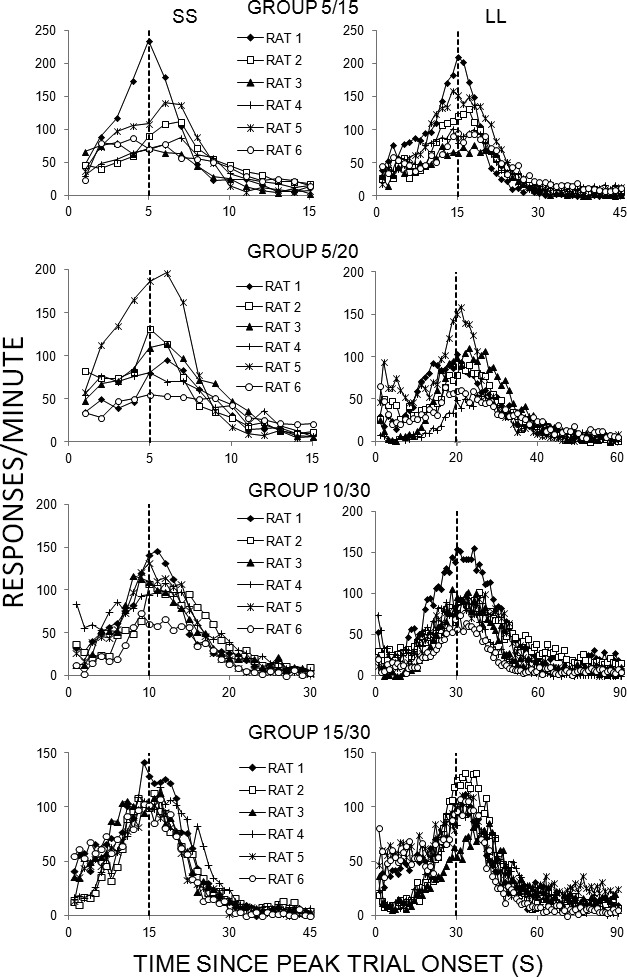
Responses/min as a function of time since peak trial onset (in seconds) on SS (left column) or LL (right column) trials for individual rats in each of the four groups in Experiment 1. The vertical axes have been scaled for each panel to enhance readability of the figures and avoid compression of data associated with lower response rates.