
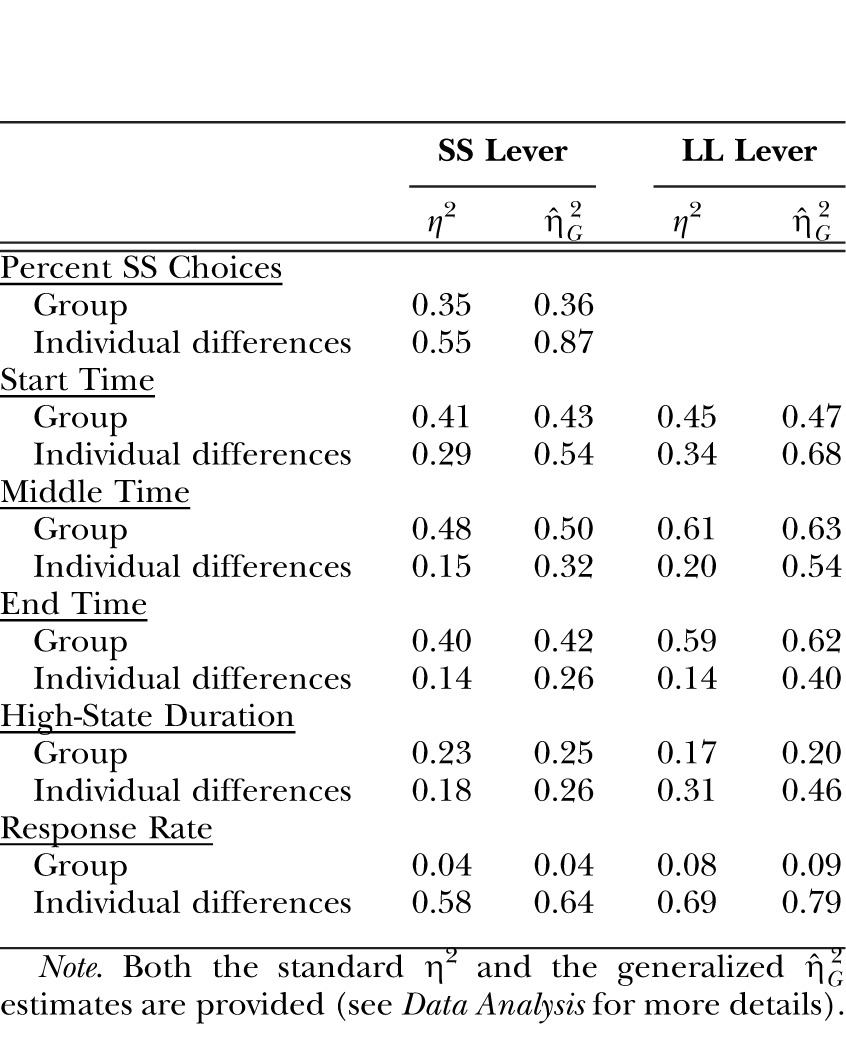
Table 1.
The effect size estimates for the Group factor and the Individual differences contributions to the dependent measures of Percent SS choices and the results of the low-high-low analysis (start, middle and end times, high-state duration, and response rate) in Experiment 1.
|
SS Lever |
LL Lever |
|||
|
η2 |

|
η2 |

|
|
| Percent SS Choices | ||||
| Group | 0.35 | 0.36 | ||
| Individual differences | 0.55 | 0.87 | ||
| Start Time | ||||
| Group | 0.41 | 0.43 | 0.45 | 0.47 |
| Individual differences | 0.29 | 0.54 | 0.34 | 0.68 |
| Middle Time | ||||
| Group | 0.48 | 0.50 | 0.61 | 0.63 |
| Individual differences | 0.15 | 0.32 | 0.20 | 0.54 |
| End Time | ||||
| Group | 0.40 | 0.42 | 0.59 | 0.62 |
| Individual differences | 0.14 | 0.26 | 0.14 | 0.40 |
| High-State Duration | ||||
| Group | 0.23 | 0.25 | 0.17 | 0.20 |
| Individual differences | 0.18 | 0.26 | 0.31 | 0.46 |
| Response Rate | ||||
| Group | 0.04 | 0.04 | 0.08 | 0.09 |
| Individual differences | 0.58 | 0.64 | 0.69 | 0.79 |
Note. Both the standard η2 and the generalized  estimates are provided (see Data Analysis for more details).