
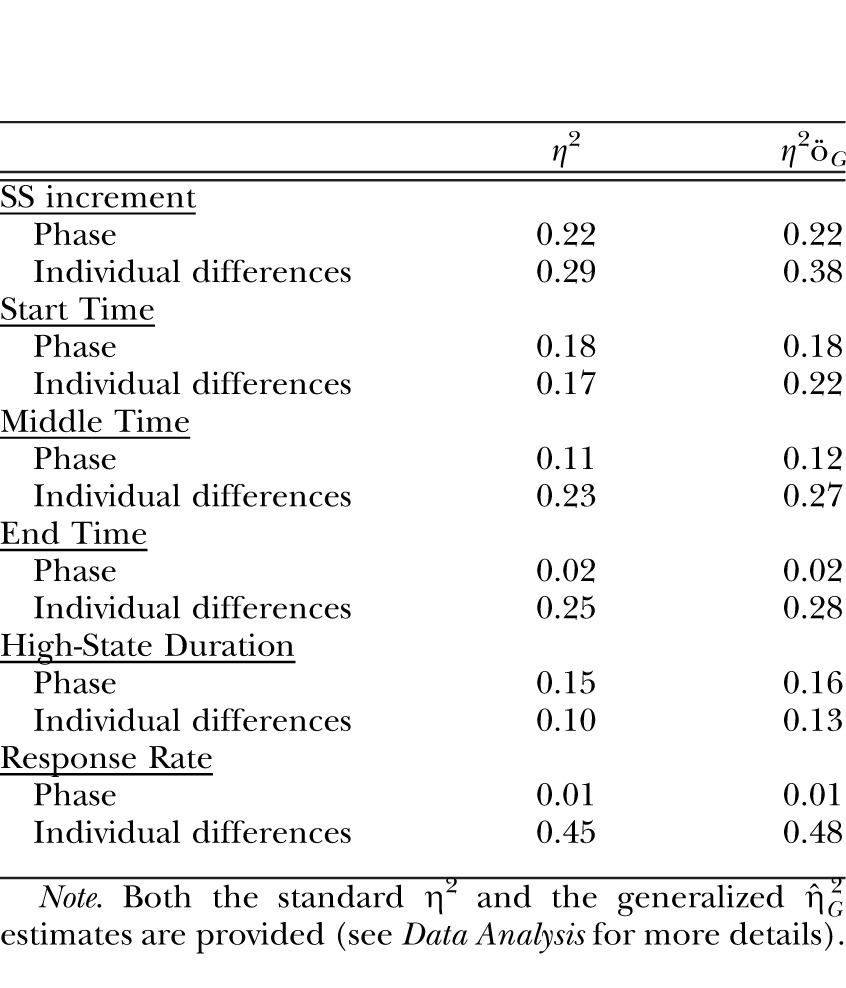
Table 2.
The effect size estimates for the Group factor and the Individual differences contributions to the dependent measures of SS increment and the results of the low-high-low analysis (start, middle and end times, high-state duration, and response rate) in Experiment 2.
|
η2 |
η2öG |
|
| SS increment | ||
| Phase | 0.22 | 0.22 |
| Individual differences | 0.29 | 0.38 |
| Start Time | ||
| Phase | 0.18 | 0.18 |
| Individual differences | 0.17 | 0.22 |
| Middle Time | ||
| Phase | 0.11 | 0.12 |
| Individual differences | 0.23 | 0.27 |
| End Time | ||
| Phase | 0.02 | 0.02 |
| Individual differences | 0.25 | 0.28 |
| High-State Duration | ||
| Phase | 0.15 | 0.16 |
| Individual differences | 0.10 | 0.13 |
| Response Rate | ||
| Phase | 0.01 | 0.01 |
| Individual differences | 0.45 | 0.48 |
Note. Both the standard η2 and the generalized  estimates are provided (see Data Analysis for more details).