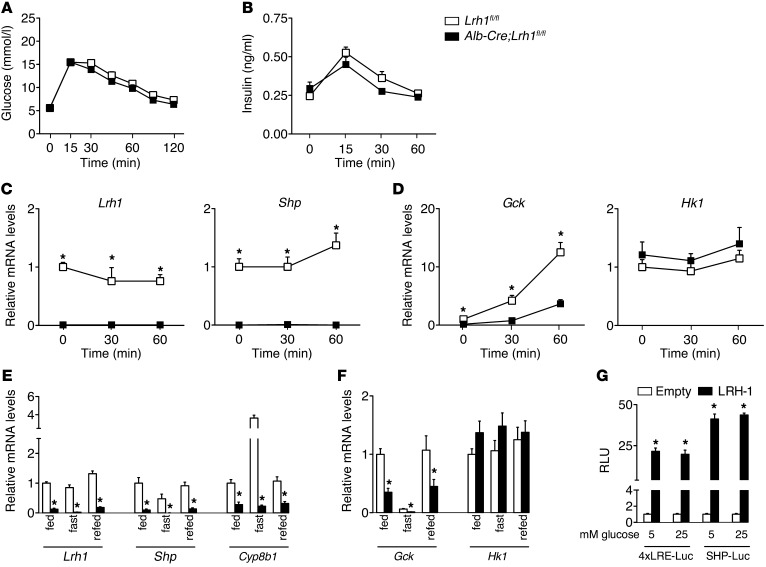
Figure 2. Reduced glucokinase expression in Alb-Cre;Lrh1fl/fl mice.
(A) Blood glucose and (B) plasma insulin concentrations (n = 10 per genotype) and (C and D) hepatic mRNA levels of Lrh1, Shp, Gck, and Hk1 during an oral glucose tolerance test (n = 4–8 per genotype) in Lrh1fl/fl mice (white boxes) and Alb-Cre;Lrh1fl/fl mice (black boxes). (E and F) Hepatic mRNA levels in fed, 24-hour–fasted or 6-hour–refed Lrh1fl/fl mice (white bars) and Alb-Cre;Lrh1fl/fl mice (black bars) (n = 7–9 per genotype). (G) LRH-1 transcriptional activity in HeLa cells transfected with a heterologous (4x LRH-1 response element–Luc [4xLRE-Luc]) or an endogenous LRH-1 reporter driven by the Shp promoter (SHP-Luc). Luciferase activity was determined in the absence (empty; white bars) or presence (LRH-1; black bars) of LRH-1 after exposure to 5 or 25 mM glucose for 24 hours. Data are expressed as relative light units (RLUs) compared with empty reporter (pGL3). Data represent mean ± SEM. *P < 0.05 versus Lrh1fl/fl or versus empty vector (pCMX).

