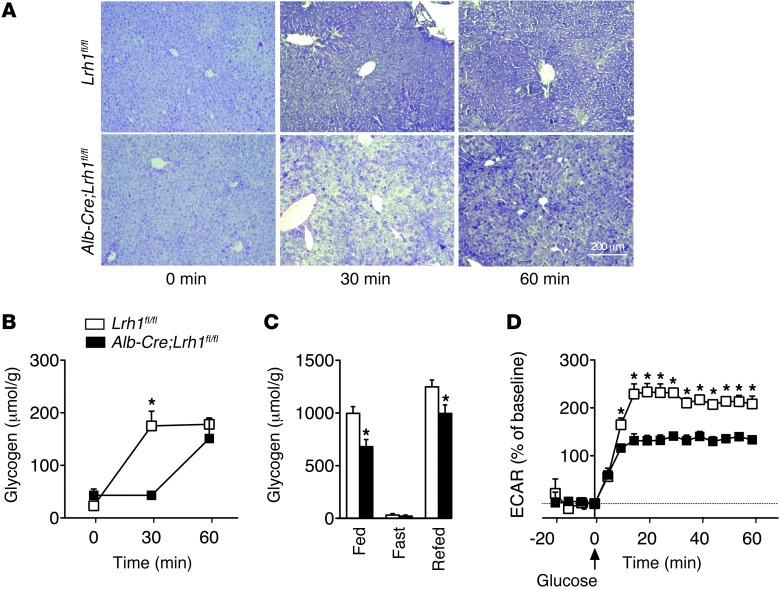
Figure 4. Delayed glycogen synthesis and reduced glycolysis in Alb-Cre;Lrh1fl/fl mice.
(A) Representative glycogen stainings during oral glucose tolerance test (n = 3–8 per genotype). Scale bar: 200 μm. (B) Quantification of hepatic glycogen content in Lrh1fl/fl mice (white boxes) and Alb-Cre;Lrh1fl/fl mice (black boxes) during oral glucose tolerance test. (C) Hepatic glycogen content in fed, 24-hour–fasted, or 6-hour–refed Lrh1fl/fl mice (white bars) and Alb-Cre;Lrh1fl/fl mice (black bars) (n = 7 per genotype). (D) Extracellular acidification rates (ECARs) in Lrh1fl/fl (white boxes) and Alb-Cre;Lrh1fl/fl (black boxes) primary hepatocytes (n = 5–6 per genotype). Data represent mean ± SEM. *P < 0.05 versus Lrh1fl/fl.

