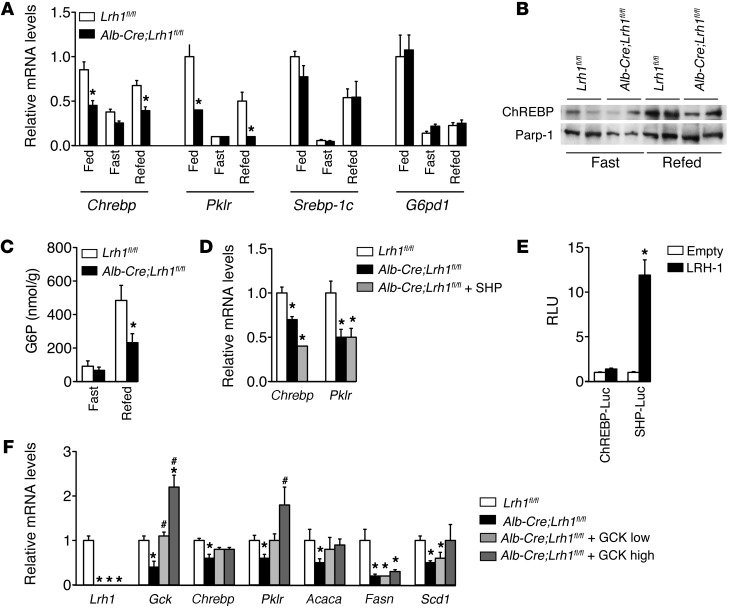
Figure 6. Impaired GCK activity in Alb-Cre;Lrh1fl/fl mice reduces ChREBP expression and activity.
(A) Hepatic Chrebp, Pklr, Srebp-1c, and G6pd1 expression in fed, 24-hour–fasted, or 6-hour–refed Lrh1fl/fl mice (white bars) and Alb-Cre;Lrh1fl/fl mice (black bars) (n = 7–9 per genotype). (B) Nuclear ChREBP protein expression in 24-hour–fasted and 6-hour–refed Lrh1fl/fl and Alb-Cre;Lrh1fl/fl mice. (C) Hepatic G6P content in fasted and refed Lrh1fl/fl mice (white bars) and Alb-Cre;Lrh1fl/fl mice (black bars) (n = 6–7 per genotype). (D) Hepatic Chrebp and Pklr expression in Alb-Cre;Lrh1fl/fl mice 5 weeks after in vivo transduction of the liver using AAV8-SHP virus (gray bars) in comparison with that in Lrh1fl/fl mice (white bars) and Alb-Cre;Lrh1fl/fl mice (black bars) (n = 4–5 per group). (E) Luciferase activities in HeLa cells transfected with Chrebp (ChREBP-Luc) or SHP (SHP-Luc) promoter (black bars) constructs in the absence (empty; white bars) or presence (LRH-1; black bars) of LRH-1. Data are expressed as relative light units and normalized to empty reporter (pGL3). (F) Hepatic mRNA levels in Alb-Cre;Lrh1fl/fl mice 5 weeks after in vivo transduction of the liver using 2 different titers of AAV8-GCK virus (low, 1011 particles per mouse [light gray bars], and high, 1012 particles per mouse [dark gray bars]) in comparison with those in Lrh1fl/fl mice (white bars) and Alb-Cre;Lrh1fl/fl mice (black bars) (n = 4–5 per group). Data represent mean ± SEM. *P < 0.05 versus Lrh1fl/fl or versus empty vector (pCMX); #P < 0.05 versus Alb-Cre;Lrh1fl/fl.

