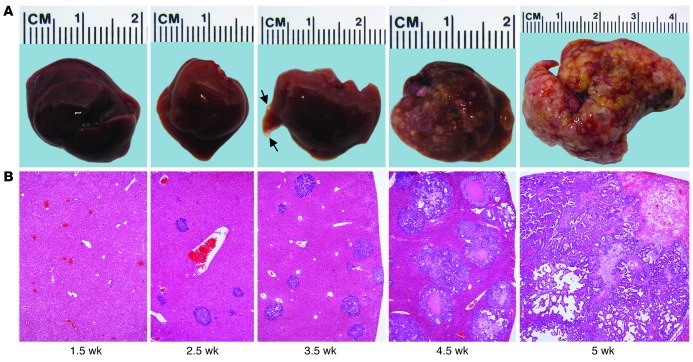
Figure 1. NICD/AKT-induced ICC formation.
(A) Photographic images of mouse livers taken at different time points after NICD/AKT plasmid injection. Small tumors (arrows) were visible as early as 3.5 weeks after injection. (B) H&E stainings of corresponding liver sections show rapidly expanding tumors replacing the normal liver parenchyma. Original magnification, ×40. At least 15 liver sections from 3 mice were analyzed for each time point.

