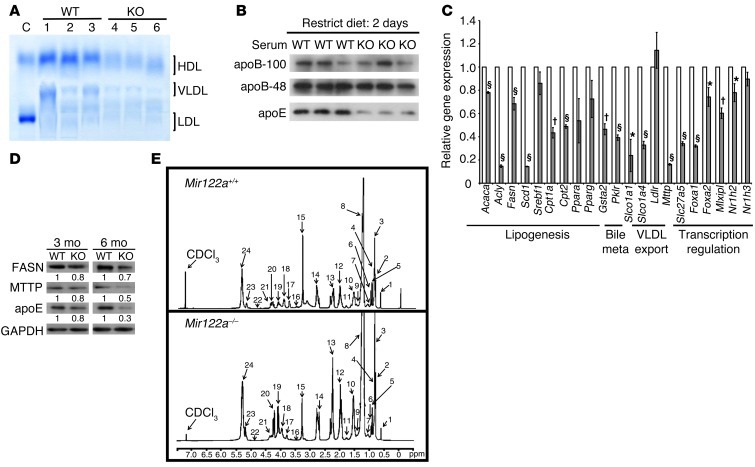
Figure 2. Analysis of lipid metabolism.
(A) Serum levels of lipoproteins. C, control: normal human serum; KO, Mir122a–/– mice. (B) Western blot analysis of the serum apoproteins. (C) RT-qPCR analysis of the genes involved in lipid metabolism. n = 5. *P < 0.05, †P < 0.01, §P < 0.001. (D) Western blot analysis of hepatic proteins. This blot is representative of 3 independent experiments. Values represent the relative levels of protein expression between Mir122a–/– and WT. (E) 1H-NMR spectra of hepatic lipid contents. 1H-NMR spectra of lipid extracts from liver of WT and Mir122a–/– mice (Mir122a-KO). Identified peaks: 1: total cholesterol C-18, CH3; 2: total cholesterol C-26, CH3/C-27, CH3; 3: fatty acyl chain CH3(CH2)n; 4: total cholesterol C-21, CH3; 5: free cholesterol C-19, CH3; 6: esterified cholesterol C-19, CH3; 7: multiple cholesterol protons; 8: fatty acyl chain (CH2)n; 9: multiple cholesterol protons; 10: fatty acyl chain -CH2CH2CO; 11: multiple cholesterol protons; 12: fatty acyl chain -CH2CH=; 13: fatty acyl chain -CH2CO; 14: fatty acyl chain =CHCH2CH=; 15: sphingomyelin and choline N(CH3)3; 16: free cholesterol C-3, CH; 17: phosphatidylcholine N-CH2; 18: glycerophospholipid backbone C-3, CH2; 19: glycerol backbone C-1, CH2; 20: glycerol backbone C-3, CH2; 21: phosphatidylcholine PO-CH2; 22: esterified cholesterol C-3, CH; 23: glycerolphospholipid backbone C-2, CH; 24: fatty acyl chain -HC=CH-.

